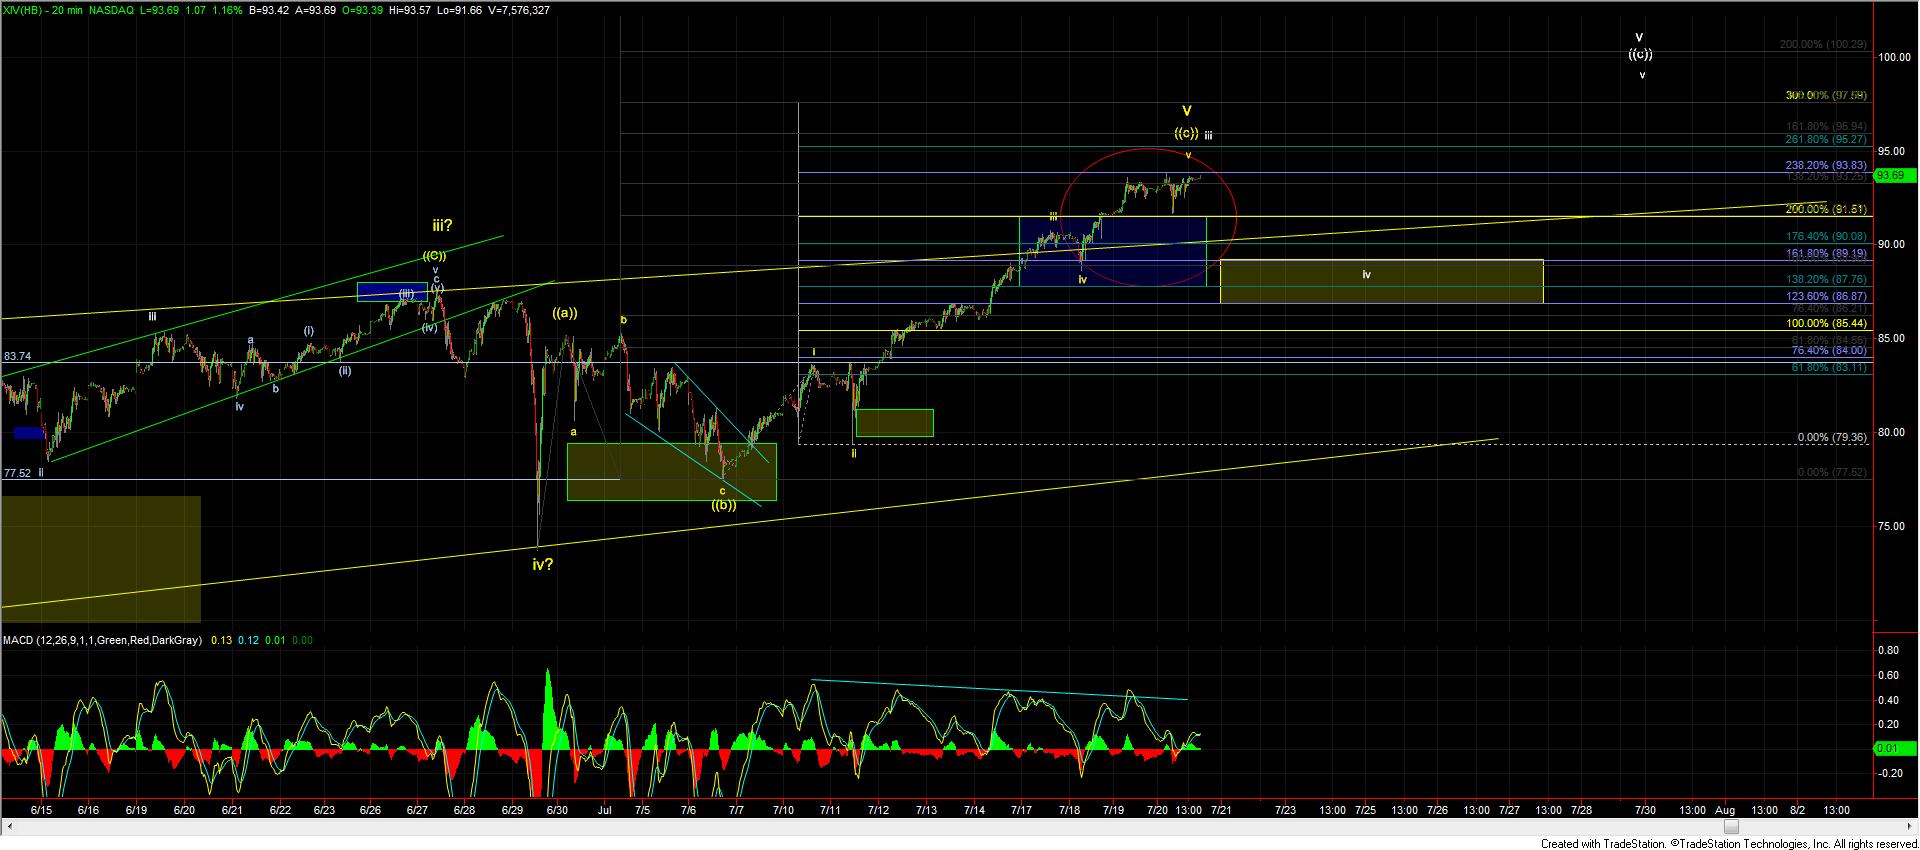
In last week’s article, I had noted that as long as the XIV was able to hold the 83.93 level, I expected to see it hit the 87.76 – 91.53 zone into this week with the potential to see a move into the mid 90’s prior to making a large degree top.

On Tuesday of this week, the XIV closed at the upper end of this 91.53 zone and then on continued to extend higher into Wednesday, and as of Thursday’s close is now trading at the 93.83 level having so far been contained by the 238.2 Fibonacci extension level of the move up off of the 7/6 low.
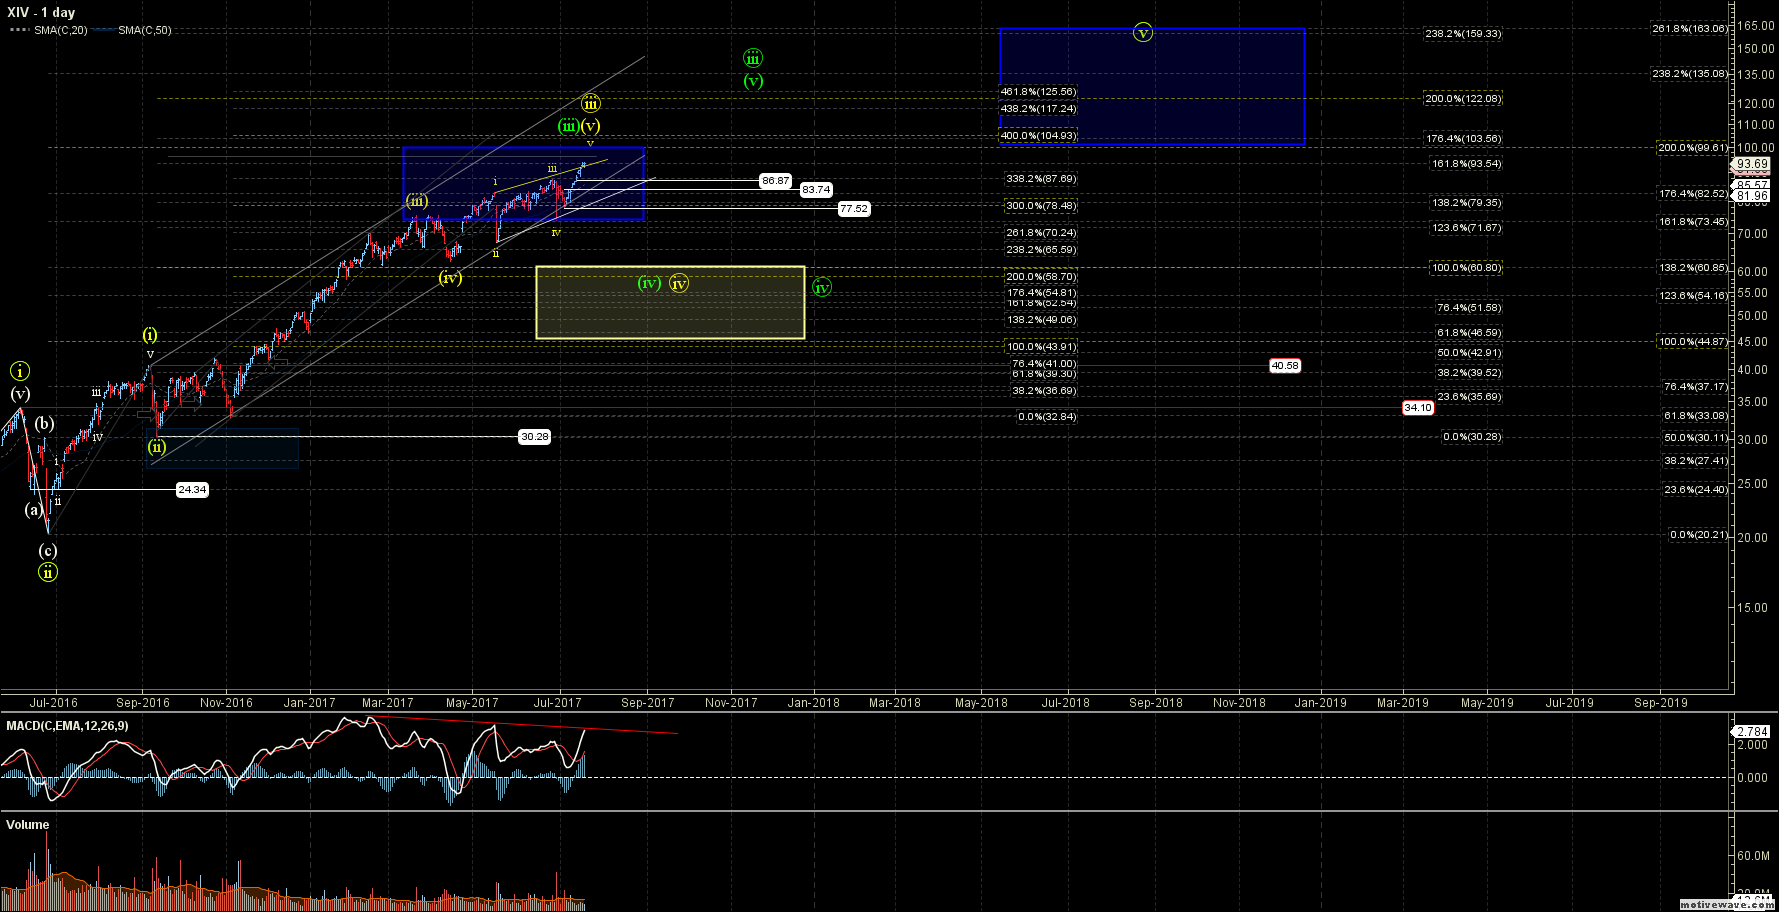
While the XIV is so far following through on the smaller degree pattern and is tracing out a very clean impulsive pattern off of the 7/6 low, it is now starting to push the limits of the upper end of what I still prefer to count as a large Ending Diagonal pattern off of the April 12th low.

The price action over the next several trading sessions should be key in helping give further clues as to where the XIV is heading in the near term.
As I noted in the title of this article, the CBOE Volatility Index or the VIX index has set some records in 2017 that have been truly remarkable and may never be seen again. Not only in ultra-low price levels but in the frequency that these ultra-low price levels have occurred.

The VIX hit an all-time low closing reading this year using both the new VIX methodology that was created in 2003 and also the old VIX methodology, which is trackable by using the VXO symbol, that dates back to the early 90s. The VXO saw a 7 handle this year, while the “new” VIX closed at 9.51 last Friday, the lowest level since the new methodology was introduced by the CBOE in 2003.
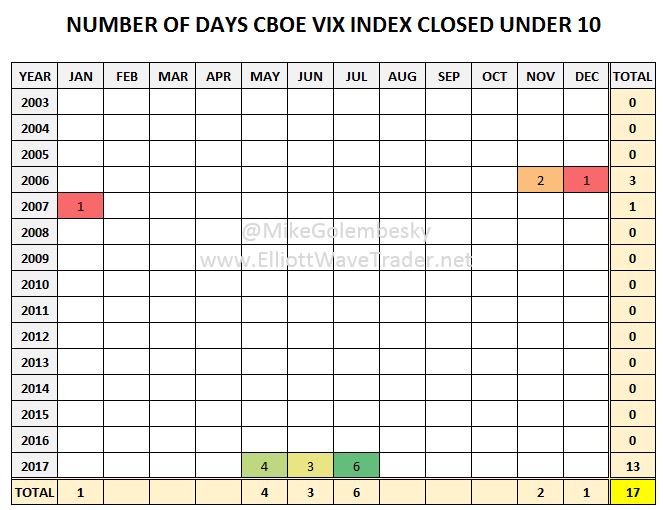
As impressive as these record low closes are, even more impressive is how long the VIX has maintained these ultra-low levels. Prior to 2017 the new VIX going back to 2003 had only closed under the 10 level four times. This occurred three times in November through December of 2006 and once more in January of 2007.

In 2017 the VIX has closed under the 10 level a total of 13 times. These occurred in May, June and July of this year. In fact, as of July 20th the last six consecutive sessions all saw the VIX close under the 10 level. That is more closes under 10 in just the last six days than had ever occurred in every year combined prior to 2017.
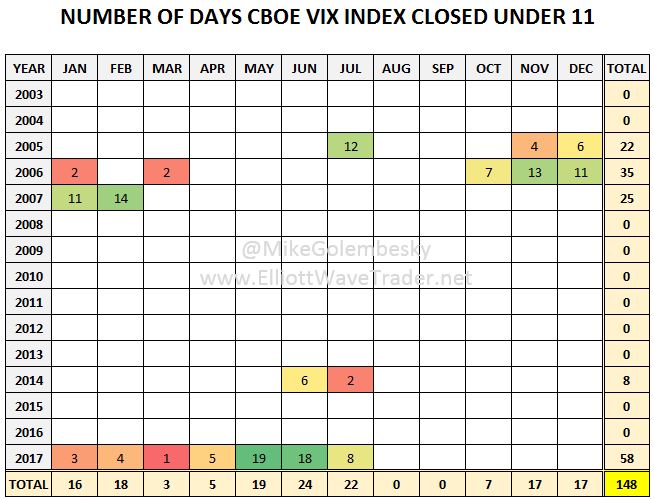
While closing under 10 is certainly ultra-low level to see, a close under the 11 level is still also very low. So low in fact that prior to 2017 the VIX had only closed under 11 in a handful of months 2006, 2007 and 2014.
This year the VIX has closed under the 11 level at least once in every single month of the year . Having closed under 11 in nineteen of the twenty-two trading days in May and eighteen of the twenty-two trading days in June. This month the VIX has closed under the 11 level in eight of the thirteen trading days that we have seen so far in the month. The total days that the VIX has traded under the 11 level in just six and half months in 2017 comes to 58; the previous record for a single year was 35 in 2006.
So while I cannot predict the future and say with certainty that these records will not be broken, I can say that I would be truly impressed if the VIX can manage to once again accomplish a feat like we have seen in 2017.
As noted above the current pattern off of the 7/6 low has been following the shorter term pattern quite well and has hit all of our expected fibs almost perfectly. The one possible exception to this is that we may have extended beyond the ideal upper target for our minor degree wave iii up off of the 7/6 low. I say possible exception because while I am still leaning towards seeing another minor degree wave iv down and v up as shown in the white count on the 20-minute chart I can make the case that we have already topped in wave iii and are currently already in wave v up per the yellow path.
I would need to see a break of at least the 86.87 level to have the initial confirmation that we have indeed topped per the yellow count with further confirmation coming with a break of the 83.74 and then 77.52 levels.
While I am still leaning towards seeing another high back into the mid-90s prior to topping, there is still quite a bit of risk in attempting to play the XIV to the upside here or Volatility in general to the downside. While I am still looking for a tradable top in the XIV, the setup has still yet to present itself. Until that setup comes I will continue to remain content on the sidelines as we still have no confirmation that this period of record setting low Volatility is behind us.
