
Xerox Corporation (NYSE:XRX) reported mixed third-quarter 2017 results with year-over-year increase in earnings despite lower revenues. GAAP earnings from continuing operations were 67 cents per share compared with 66 cents in the year-ago quarter.
Adjusted earnings from continuing operations for the reported quarter were 89 cents per share compared with 84 cents in the year-earlier quarter. The year-over-year increase in earnings despite lower revenues was primarily attributable to lower operating expenses. Adjusted earnings comfortably beat the Zacks Consensus Estimate of 79 cents.
Total revenue for the quarter was $2,497 million compared with $2,629 million in the year-earlier quarter. Revenues missed the Zacks Consensus Estimate of $2,509 million.
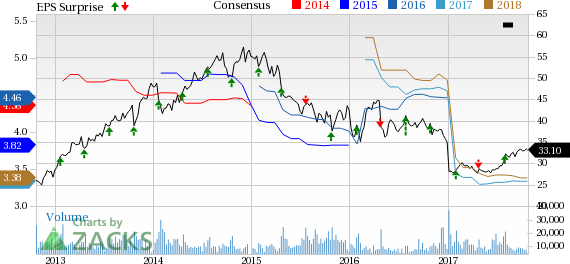
Xerox Corporation Price, Consensus and EPS Surprise
Xerox Corporation Price, Consensus and EPS Surprise | Xerox Corporation Quote
Margins
Adjusted gross profit for the quarter was $1,003 million compared with $1,050 million in the prior-year period. Adjusted gross profit margin for the quarter was 40.2% compared with 39.9% in the prior-year quarter. Adjusted operating margin was 12.2%, down 40 basis points year over year.
Financial Position
As of Sep 30, 2017, Xerox had cash and cash equivalents of $1,781 million while long-term debt was $5,235 million. Net cash used in operating activities for the quarter was $385 million compared with operating cash flow of $370 million in the year-ago period, bringing the respective cash flow tallies for the year to $53 million and $522 million.
Updated Guidance
Xerox updated its full-year 2017 guidance. It currently expects GAAP earnings from continuing operations in the range $1.97 to $2.13 per share (compared with previous range of $1.84 to $2.08) and adjusted earnings in the range $3.28 to $3.44 (compared with earlier range of $3.20 to $3.44). The company expects cash flow to be around $800 - $1,000 million, up from earlier range of $700 - $900 million.
Xerox currently holds a Zacks Rank #4 (Sell). Some better-ranked stocks in the industry include Avis Budget Group, Inc. (NASDAQ:CAR) , Vectrus, Inc. (NYSE:VEC) and Capita plc CTAGY, each carrying Zacks Rank #2 (Buy). You can see the complete list of today’s Zacks #1 Rank (Strong Buy) stocks here.
Avis Budget is currently trading at a forward P/E of 15.6x.
Vectrus is currently trading at a forward P/E of 16.7x.
Capita plc is currently trading at a forward P/E of 10.5x.
Looking for Stocks with Skyrocketing Upside?
Zacks has just released a Special Report on the booming investment opportunities of legal marijuana.
Ignited by new referendums and legislation, this industry is expected to blast from an already robust $6.7 billion to $20.2 billion in 2021. Early investors stand to make a killing, but you have to be ready to act and know just where to look.
See the pot trades we're targeting>>
Avis Budget Group, Inc. (CAR): Free Stock Analysis Report
Vectrus, Inc. (VEC): Free Stock Analysis Report
Xerox Corporation (XRX): Free Stock Analysis Report
CAPITA PLC (CTAGY): Free Stock Analysis Report
Original post
Zacks Investment Research