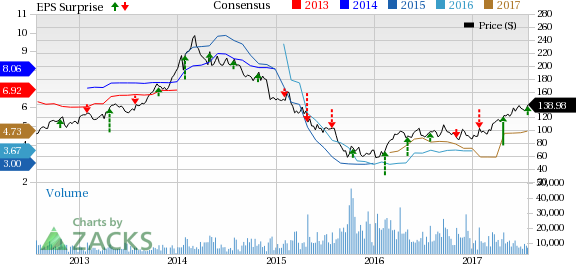
Wynn Resorts Ltd. (NASDAQ:WYNN) posted solid results for second-quarter 2017, with earnings and revenues beating the Zacks Consensus Estimate.
However, the company’s shares declined nearly 4% in afterhours trading on Jul 25, mirroring investor concerns surrounding the weakness in Macau’s mass market and somewhat lower-than-expected results at Wynn palace.
Earnings and Revenues Discussion
Adjusted earnings per share of $1.18 surpassed the Zacks Consensus Estimate of $1.09 by 8.3%. Further, earnings increased 10.3% from the year-ago figure of $1.07, given a substantial rise in revenues.
Wynn Resorts’ revenues of $1.53 billion topped the Zacks Consensus Estimate of $1.45 billion by 5.3%. Moreover, revenues increased 44.5% given significant contribution from Wynn Palace along with favorable performance by the company’s Las Vegas Operations and higher revenues from Wynn Macau.
Adjusted property earnings before interests, taxes, depreciation and amortization (EBITDA) surged 37.5% to $430 million year over year on higher revenues.
Meanwhile, total operating costs and expenses increased 40.8% to around $1.28 billion, primarily owing to a rise in casino, rooms, food and beverage, entertainment, retail and other as well as general and administrative expenses.
Macau Operations
Wynn Resorts reports its Macau table games results under two segments – VIP and mass market.
Wynn Macau
Wynn Macau revenues increased 6.8% year over year to $682.7 million in the quarter owing to higher casino revenues, somewhat offset by lower non-casino revenues.
Notably, casino revenues from Macau operations jumped 7.4% to $654.7 million. Meanwhile, table games turnover in the VIP segment soared 35.3% to $16.02 billion. However, the VIP table games win rate (based on turnover) was 3.53%, down 45 basis points (bps) year over year but above the projected range of 2.7% to 3%.
Table drop in the mass market segment was $1.07 billion, down 9%. Table games win in the mass market category amounted to $221.6 million, down 5.8%. Nevertheless, mass market win rate was 20.8%, up 80 bps.
Non-casino revenues before promotional allowances declined 10.8% to $60.8 million. Meanwhile, room revenues decreased 12.4% to $25.7 million. Revenue per available room (RevPAR) plunged 14.3% in the quarter to $252 million as average daily rate (ADR) declined 19.6%. But occupancy rate increased 600 bps to 97.5%.
In the quarter, adjusted property EBITDA was $210.4 million, up 10.5% year over year.
Wynn Palace
On Aug 22, 2016, Wynn Resorts’ chairman of the board and chief executive officer, Steve Wynn, unveiled the Wynn Palace resort in the Cotai area of Macau. Thus, the second quarter of 2017 represents the third full quarter of operations for this resort.
Wynn Resorts’ revenues from Wynn Palace were $414.7 million in the quarter, while casino revenues totaled to $372.2 million.
While table games turnover in the VIP segment was nearly $11.60 billion, VIP table games win rate (based on turnover) was 2.18%, below the expected range of 2.7–3%.
Notably, table drop in the mass market segment was $729 million. Meanwhile, table games win in mass market operations amounted to $168.7 million and mass market win rate was 23.1%.
Non-casino revenues, before promotional allowances were $79.5 million. During the quarter, room revenues were $35.4 million with an ADR of $232 million, occupancy of 96.2% and REVPAR of $224 million. In the quarter, adjusted property EBITDA stood at $87.4 million.
Though Wynn Palace is poised to witness increased visits from tourists and leisure gamblers over the long term, foot traffic has been low of late due to construction around the resort. As a result, the company failed to fully capitalize on the rebound in Macau gaming revenues in the quarter.
Las Vegas Operations
Wynn Resorts’ revenues from Las Vegas operations were up 3.1% to $431.9 million on the back of higher casino and non-casino revenues. Notably, casino revenues from Las Vegas operations inched up 4.8% to $139.3 million. Meanwhile, table games win percentage was 24.2%, up 170 bps and above management’s guided range of 21–25%.
Total non-casino revenues, before promotional allowances, increased 1.5% to $332.2 million year over year. Room revenues were up 1.4% to $115.1 million. During the quarter, RevPAR grew 1.9% to $268 million on the back of a 340 bps increase in occupancy rate and a 1.9% rise in ADR. While food and beverage revenues increased 4% to $160.1 million, entertainment, retail and other revenues decreased 4.9% to $57 million. Adjusted property EBITDA was up 8.1% to $132.2 million.
Zacks Rank & Upcoming Releases
Wynn Resorts carries a Zacks Rank #2 (Buy). You can see the complete list of today’s Zacks #1 Rank (Strong Buy) stocks here.
Among other casino operators, MGM Resorts International (NYSE:MGM) , Melco Resorts & Entertainment Limited (NASDAQ:MLCO) and Penn National Gaming, Inc. (NASDAQ:PENN) are expected to release second-quarter numbers on Jul 27. The Zacks Consensus Estimate for the quarter’s earnings is pegged at 28 cents, 20 cents and 24 cents for MGM Resorts, Melco Resorts and Penn National Gaming, respectively.
The Hottest Tech Mega-Trend of All
Last year, it generated $8 billion in global revenues. By 2020, it's predicted to blast through the roof to $47 billion. Famed investor Mark Cuban says it will produce ""the world's first trillionaires,"" but that should still leave plenty of money for regular investors who make the right trades early. See Zacks' 3 Best Stocks to Play This Trend >>
Wynn Resorts, Limited (WYNN): Free Stock Analysis Report
MGM Resorts International (MGM): Free Stock Analysis Report
Penn National Gaming, Inc. (PENN): Free Stock Analysis Report
Melco Crown Entertainment Limited (MLCO): Free Stock Analysis Report
Original post
Zacks Investment Research

