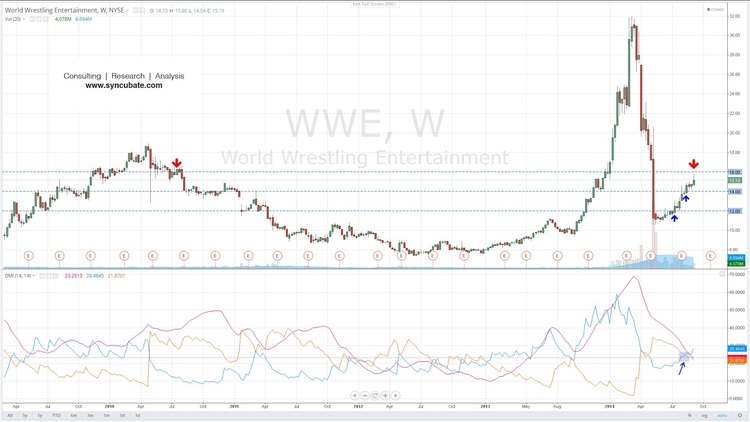
When we first wrote about World Wrestling Entertainment (NYSE:WWE) in early July, its stock was trading at $12 a share.
In our initial analysis of the stock, we observed that a rise after its steep fall in the months prior was a possibility given the consolidation in price that had occurred through the end of June and the rising RSI signal on the daily chart.
We followed up on our initial post with a recap in early August. At that point, WWE had crossed decidedly above $12 a share and we pointed out that the $14 level would likely be an approaching resistance area.
Since July, WWE is now up over $3 a share, nearly a 30% increase in value in less than three months, closing last Friday's session at $15.19.
The stock went as high as $15.88 last week, before pulling back. As evident from the weekly chart below, the $16 level is likely to be a ceiling of resistance for the bulls moving forward.
Looking back to the Summer of 2010, the $16 region on the chart has historically been a difficult one for the bulls to overcome and hold above.
In early January of this year, when the $16 level was convincingly cleared by the bulls, we witnessed WWE's epic rise in price, as the stock went on to double in value by mid-March, going to as high as $31.98 a share. With this doubling in value, WWE's Chairman and CEO, Vince McMahon, became a billionaire on paper.
The chart has had significant damage done to it following a steep sell off that ensued on investor disappointment about the value of the company's renewed television deal with NBC. The sell off went on to eventually erase all of WWE's gains for the year and sent the stock to as low as $10.55 a share by mid-May.
WWE is now at a crossroads. Those who bought the stock at the end of 2013 are now slightly ahead or at breakeven, whereas those who bought it above $16 after January and into its rise above $30 a share are still in the red.
+DMI recently crossed above -DMI on the weekly chart for the first time since the May sell off, so the bulls are inching ahead of the bears for now.
However, the ADX line is not rising, so what this essentially means is that the stock is not trending in the intermediate time frame. We're in a trading range from the weekly vantage point, with $16 being resistance above, and $14 and $12 being support levels below.
It remains to be seen whether WWE will be able to convince investors that its worth more than its currently trading at. The company has to prove the viability of its WWE Network in the long run - on a fundamental level, this is what investors on the sidelines are waiting to see.

