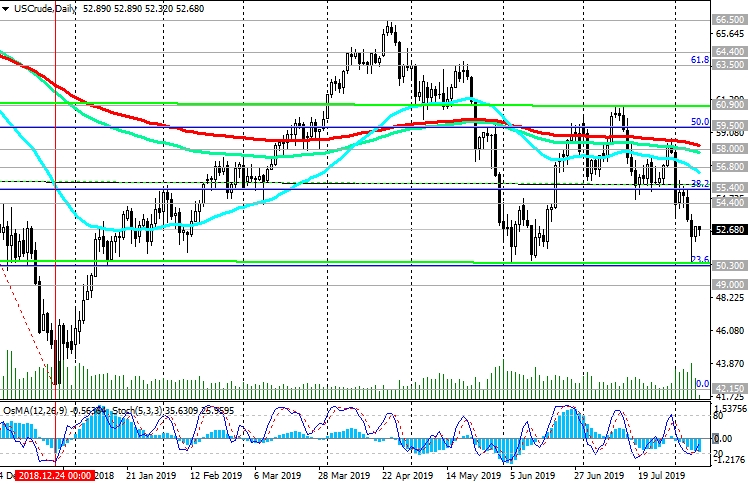
Global financial markets remain under pressure from intensified international trade conflicts, primarily between the United States and China. The oil market does not stand aside. Oil prices are actively declining, having lost about 25% over the past 12 months.
Last Thursday, the price reached a new 7-month low near $ 50.47 per barrel of WTI Crude after Donald Trump announced the introduction of new duties on the import of Chinese goods into the United States.
The trade conflict between the United States and China reached a new level when Chinese authorities announced retaliation. In particular, Beijing banned Chinese state-owned companies from buying soybeans in the United States, and the People's Bank of China lowered the RMB to dollar exchange rate below 7.0000.
The oil market received an additional negative impetus after last Wednesday the US Department of Energy’s Energy Information Administration reported an increase in oil reserves in the country last week (+2.385 million barrels, while oil reserves were expected to fall by 2.845 million barrels).
The fall in oil prices indicates an increase in investor anxiety about the state of the global economy, which continues to negatively affect financial markets.
The breakdown of the support level of 50.30 (Fibonacci level 23.6% of the upward correction to the fall from the highs of the last few years near the level of 76.80 to the level of support near the mark of 42.15) and a further decrease will mean the return of WTI oil prices to the global bearish trend.
In this case, the preliminary reduction targets will be located at the support level of 42.15 (Fibonacci level of 0% and December 2018 lows).
In an alternative scenario, the signal to resume purchases will be a breakdown of the short-term resistance level 54.40 (ЕМА200 on the 1-hour chart) and growth into the zone above the resistance level 55.40 (Fibonacci 38.2%) with targets at the resistance level 58.80 (ЕМА200 on the daily chart). Fixing the price in the zone above the resistance level of 59.50 (Fibonacci level of 50%) will speak about the resumption of the bull trend.
On Friday, oil market participants will follow the publication (at 17:00 GMT) of the weekly report of the American oilfield services company Baker Hughes on the number of active drilling rigs in the United States. Previous reports indicated a decrease in the number of active oil platforms in the United States, to 770 units at the moment. If the report again indicates a decrease in the number of such installations, then this may give a short-term positive impetus to prices.
However, a strong negative momentum prevails. Short positions are preferred.
Support Levels: 50.30, 49.00, 42.15
Resistance Levels: 54.40, 55.40, 56.80, 58.00, 59.50, 60.90, 63.50, 64.40, 66.50
Trading Scenarios
Sell Stop 51.85. Stop-Loss 53.75. Take-Profit 50.30, 49.00
Buy Stop 53.75. Stop-Loss 51.85. Take-Profit 54.40, 55.40, 56.80, 58.00

