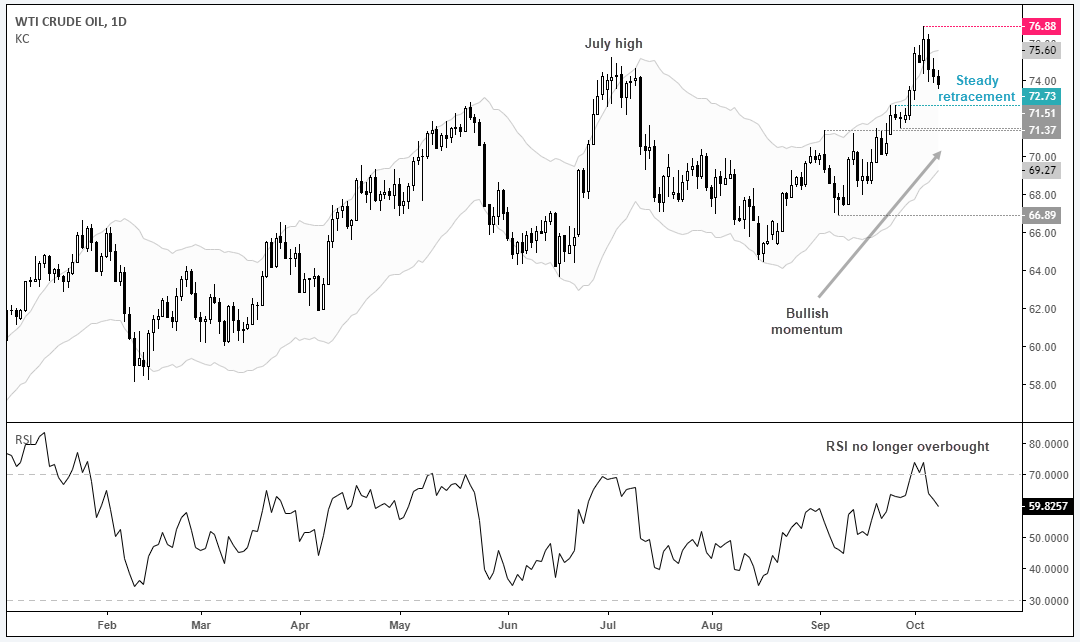
Whilst WTI undergoes a steady retracement from its four-year high, we’re paying close attention to its depth as a $1 drop could confirm a bearish reversal.

Starting on the daily chart we can see that the trend structure remains firmly bullish overall and price action has provided a shallow retracement from 76.88. Since our video last week, RSI is no longer overbought, and prices have returned beneath the upper Keltner band which removes our original concerns of overextension. And, whilst today marks its third consecutive bearish session, it remains elevated relative to its prior swing low at 71.51 low. Moreover, as the retracement hasn’t even reached 38.2%, price action points towards an orderly retracement and shows potential for a break to new highs.
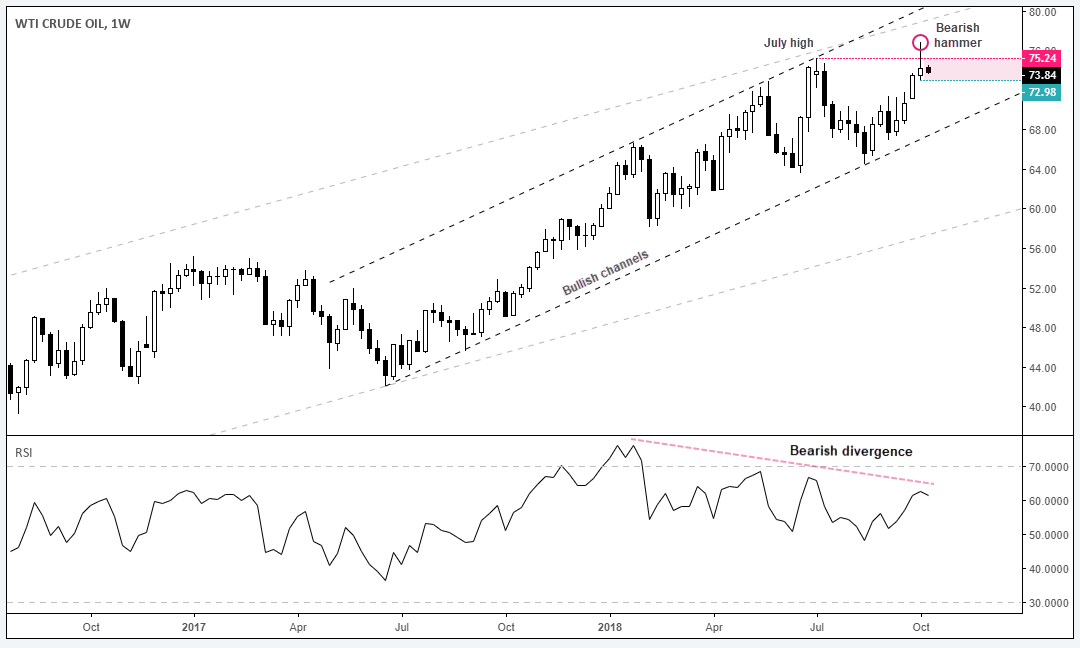
However, when we switch to the weekly chart we see a potential threat; a decline of just one dollar confirms a bearish hammer reversal and a break of last week’s low. Given this would happen beneath July’s highs warns of a potential fakeout (aka bull-trap). Furthermore, large speculators remain hesitant to pile into WTI at these highs and, if we’re to see a pick-up of short interest, we could be dealing with a deeper correction.

Still, the weekly trend structure remains bullish overall and price action continues to respect its bullish channels. Therefore, we’d see a break below 72.98 as a near-term reversal as opposed to a significant top. But we’ll continue to keep a close eye on the 72.98-75.24 range as a breakout of it could mark its next noteworthy move.
