Who is Kevin Hassett? Wolfe looks at the Trump ally tipped to become Fed Chair.

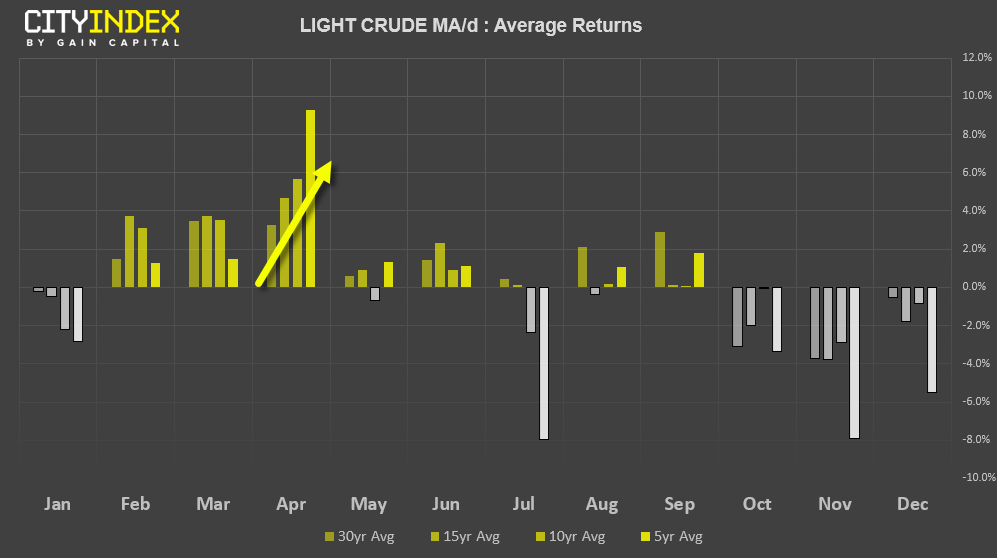
We highlighted previously that April tends to be the most bullish month for WTI and, having gained 7.3% this month already, is on track to retain its trend.
The daily trend structure remains firmly bullish with minor pullbacks and timely cycles. Furthermore, the 8, 21 and 50 eMA’s are fanning and prices are bobbing along the 8-eMA to underscore the strength of the overall trend. Prices have found resistance around the August lows, although yesterday’s bullish engulfing candle suggests WTI may try to break to new cycle highs.
A break above $65 would confirm a bull flag on the daily chart and assume a run towards the $67.88 high. If it holds above $63 and breaks higher, it’s another testament to the trend’s strength, but it wouldn’t be the end of the world if we saw a deeper retracement towards the $61.80 area first. Either way, we’re watching closely for a break above $65 to bring the $67.88 high into focus.
