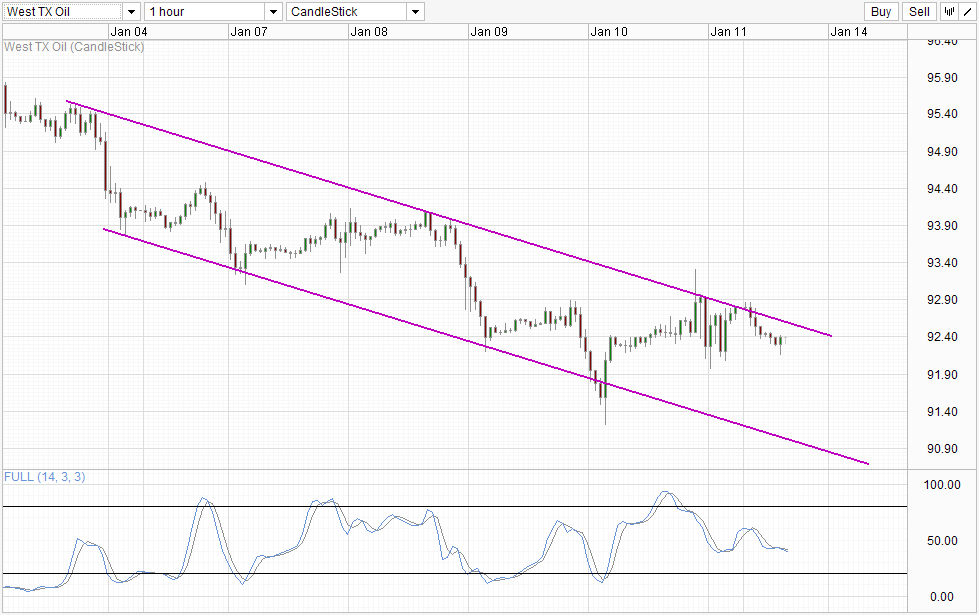
Prices of WTI continue to decline despite the initial bullish jump when a weaker than expected NFP print was released last Friday. It is debatable how one should interpret the NFP numbers, as equities traders thought that it was bearish, while Gold traders considered it bullish as they believe that weaker payroll numbers would deter Yellen and the new FOMC voting members that further tapering should not occur so soon. Things get even more complicated when you consider that WTI prices traded sharply lower a couple of hours after the numbers were released, yet prices recovered once again to close at $92.8 a barrel, which is the level around the swing high of 9th Jan, but a significant way above recent swing low of $91.22 and more importantly a decent recovery post NFP low of $92.3.
Nonetheless, regardless of what the "proper" reaction of NFP numbers should be, it is clear that prices is respecting technical trendlines well. The decline post NFP last Friday coincide with the confirmation of Channel Top holding after the initial bullish push when NFP numbers were released failed to close above the aforementioned Channel Top. This morning's decline also coincide with the holding of Channel Top after the late Friday push failed to overcome the same trendline. Hence, knowing that technical pressures remain strong, we can reasonably assume that direction of WTI remains bearish in the Short-Term, with the next bearish target being Channel Bottom and $92.0 - 92.20 band interim support.
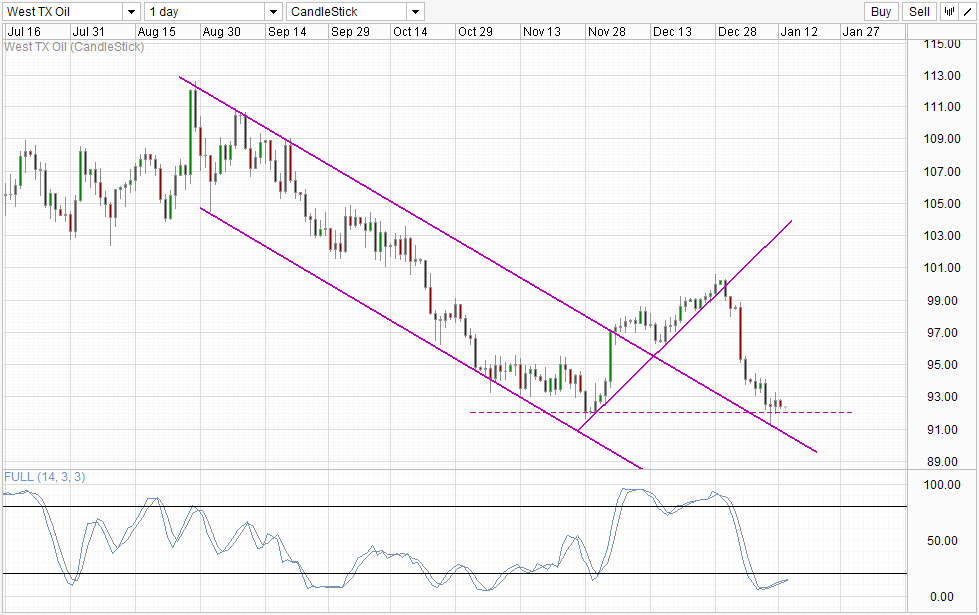
Daily Chart is similarly bearish, but a short/mid term bullish pullback cannot be ruled out as long as price stay above $92.0. Firstly, prices appears to have rebounded off the descending Channel Top, and Stochastic curve is pointing higher, potentially breaking the 20.0 level and giving us a bullish cycle in the next few days. Furthermore, there hasn't been a significant bullish pullback or a technical rebound since the sharp decline from above 100.0 back in late Dec, and a pullback scenario is highly possible from here out. However, bulls should ideally break $93.0 resistance, which will lead us back into the 93.0 - 95.0 consolidation range that was found in the month of Nov 2013.
Fundamentally, Crude Oil is still bearish though. Institutional speculators have cut their bullish bets, with latest Commitment of Traders report showing the largest decline of net-long positions since June 2013. Short bets have also enjoyed the largest weekly gain since April 2013 - highlighting the change in sentiment of speculators. The nuclear crisis of Iran appears to be easing as well, as the UN security council members are reported to be closer to implementing the deal to halt Iran's nuclear program. This is certainly not a game changer but will definitely alleviate a lot of the tension that has kept Crude prices afloat even when global demand is falling. Take away this safety net, we could see WTI potentially fall further in early 2014.
Original post
- English (UK)
- English (India)
- English (Canada)
- English (Australia)
- English (South Africa)
- English (Philippines)
- English (Nigeria)
- Deutsch
- Español (España)
- Español (México)
- Français
- Italiano
- Nederlands
- Português (Portugal)
- Polski
- Português (Brasil)
- Русский
- Türkçe
- العربية
- Ελληνικά
- Svenska
- Suomi
- עברית
- 日本語
- 한국어
- 简体中文
- 繁體中文
- Bahasa Indonesia
- Bahasa Melayu
- ไทย
- Tiếng Việt
- हिंदी
WTI Crude: Technicals Point Lower
ByMarketPulse
AuthorMingze Wu
Published 01/13/2014, 04:58 AM
Updated 03/05/2019, 07:15 AM
WTI Crude: Technicals Point Lower
Latest comments
Loading next article…
Install Our App
Risk Disclosure: Trading in financial instruments and/or cryptocurrencies involves high risks including the risk of losing some, or all, of your investment amount, and may not be suitable for all investors. Prices of cryptocurrencies are extremely volatile and may be affected by external factors such as financial, regulatory or political events. Trading on margin increases the financial risks.
Before deciding to trade in financial instrument or cryptocurrencies you should be fully informed of the risks and costs associated with trading the financial markets, carefully consider your investment objectives, level of experience, and risk appetite, and seek professional advice where needed.
Fusion Media would like to remind you that the data contained in this website is not necessarily real-time nor accurate. The data and prices on the website are not necessarily provided by any market or exchange, but may be provided by market makers, and so prices may not be accurate and may differ from the actual price at any given market, meaning prices are indicative and not appropriate for trading purposes. Fusion Media and any provider of the data contained in this website will not accept liability for any loss or damage as a result of your trading, or your reliance on the information contained within this website.
It is prohibited to use, store, reproduce, display, modify, transmit or distribute the data contained in this website without the explicit prior written permission of Fusion Media and/or the data provider. All intellectual property rights are reserved by the providers and/or the exchange providing the data contained in this website.
Fusion Media may be compensated by the advertisers that appear on the website, based on your interaction with the advertisements or advertisers.
© 2007-2025 - Fusion Media Limited. All Rights Reserved.
