Crude oil remain stable, trading above 103.0 despite suffering a minor dip yesterday. Major newswires attributed the decline to an increase in Crude Supply, but that may not entirely accurate as inventory numbers only grew 0.97 million barrels vs an expected 2.25 million barrels. This is also a huge improvement from previous week's gain of 3.27 million barrels. All in all, the numbers from the Department of Energy does not seem to be half bad, and should not have triggered any bearish selling behaviour even if market did not regard this as bullish.
Hourly Chart

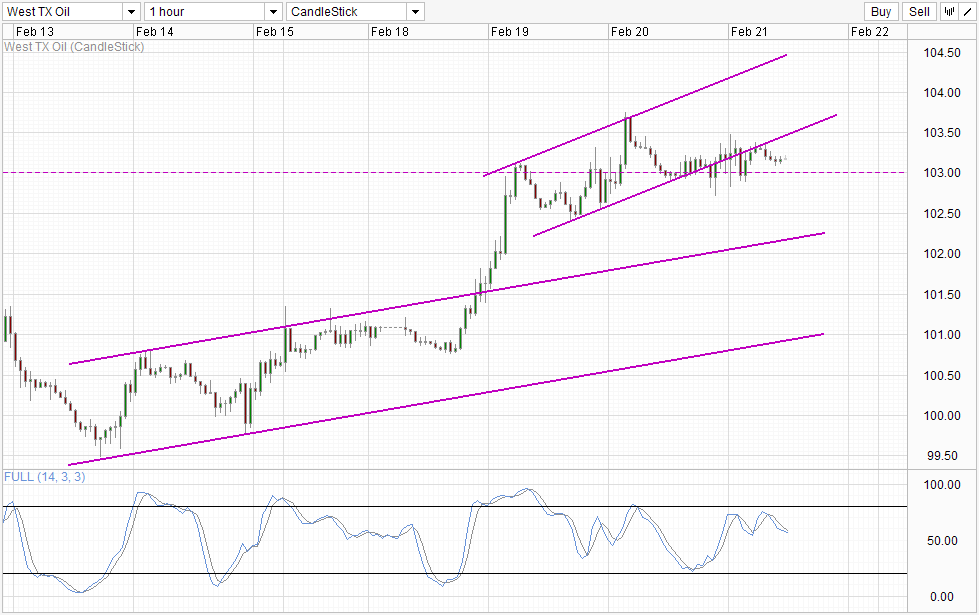
Hence, it is not surprising to see 103.0 support staying intact, especially since a truly bearish economic news in the form of 7-months low HSBC/Markit Chinese Manufacturing PMI which was released during early Asian hours yesterday failed to achieve that. Looking at price action, even though prices did break below the rising Channel Bottom, we did not see any extra bearish pressure emerging to break 103.0, highlighting the strength of 103.0 as a support and also the fact that Crude traders are not exactly the most bearish bunch right now. Certainly the rally in US stocks which improved risk appetite helped, but credit should still be given to WTI bulls that have managed to withstand pressure winds coming from weaker Philly Fed index and Initial/Continuing Jobless Claims numbers.
What this suggest is that we should still be able to see prices staying above 103.0 for now. Even though Stochastic readings suggest that a bearish cycle may be coming with both Stoch and Signal lines pointing lower, it should be noted that Stoch curve has an equal if not higher chance of rebounding higher here given that a "support" level around 52.5 can be seen if we look back at how Stoch curve moved in the past week.
Daily Chart

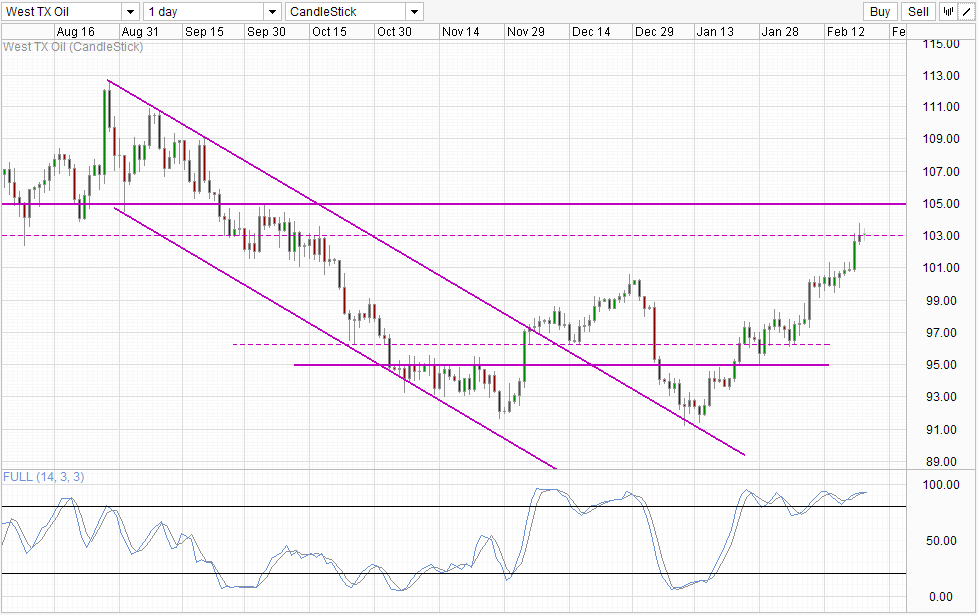
Daily Chart suggest that a move towards 105.0 is still possible. That is assuming that the bullish momentum from mid Jan is still in play with a confirmed break of 103.0 - which is still lacking as we can't say conclusively for now as prices still continue to stay close to the 103.0 level. Stochastic readings is heavily Overbought, but traders may wish to ignore this for now unless the bearish rejection of 103.0 can be confirmed as counter-trend Stochastic signals are less reliable when faced with strong trends. Hence, we do not have strong evidence either way for a bullish continuation or a bearish reversal right now. Coupled this with S/T price movements that isn't really fundamentally supported makes trading WTI risky and conservative traders may wish to stay away until more clarity is provided.
