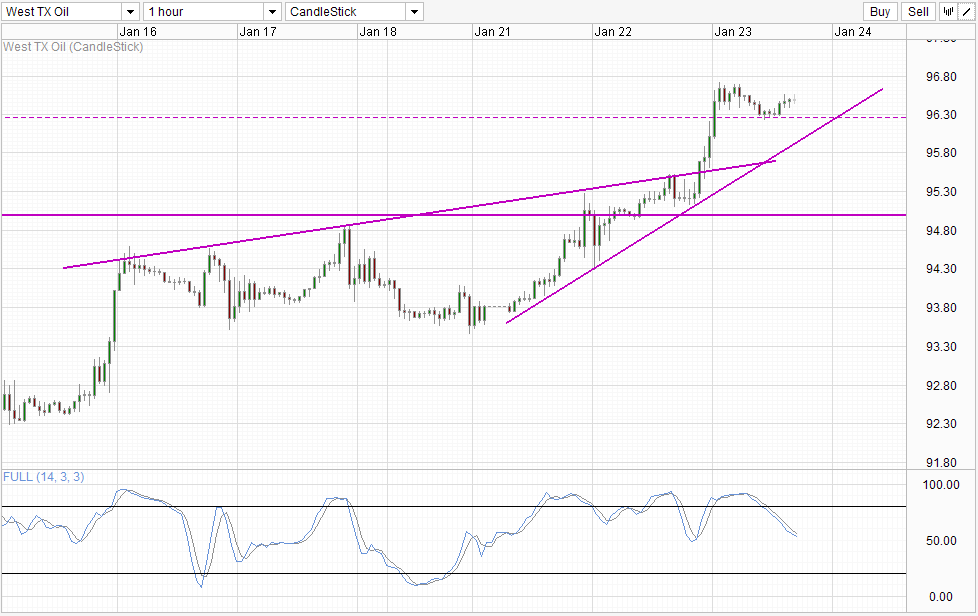
Crude Oil prices rallied during early US session despite stock market being less than bullish during the same period of time. Price started to ease back towards the end of US trading session, with bearish momentum pulling prices all the way down to $96.25 a barrel by the time Japanese market is opened. This decline is insignificant compared to the bullish move that has started when price was trading around $93.80 a barrel earlier this week, and is interesting to see $96.25 holding despite data from American Petroleum Institute showing that crude oil stockpile has increased by 4.86 million barrels, much more than the median analyst estimates of 1.75 million. This would also mark the break of 7 consecutive weeks of decreasing inventory, and implies demand in Crude is decreasing once more - a notion corroborated by rumors/speculation that China's demand for energy will slow after a shrinking manufacturing sector reflected by a surprisingly bearish Manufacturing PMI compiled by HSBC.
Hourly Chart

Hence, it is highly interesting to see that WTI prices remain robust even though there are strong bearish factors that should have dragged prices much lower. This highlights that sentiment in WTI remain strong, and the bullish rally since 14th Jan is still ongoing.
That being said, price could still trade flat for the rest of today until rising trendline start to exert bullish technical pressure to nudge prices higher. This would allow Stochastic readings to continue pushing lower until a more convincing bullish cycle signal can be made.
Given that price has managed to ward off both Chinese PMI and API bearish numbers with ease, today's crude inventory data by Energy Information Administration may not invoke a strong bearish reaction should inventory numbers fall by less than 4.86 million barrels. And should price stay above 96.25 if EIA numbers are more negative than 5 million, this would be a strong testament to the bullish sentiment in crude, and we could potentially see further bullish extension that can bring us to the previous swing high of 96.7 and beyond.
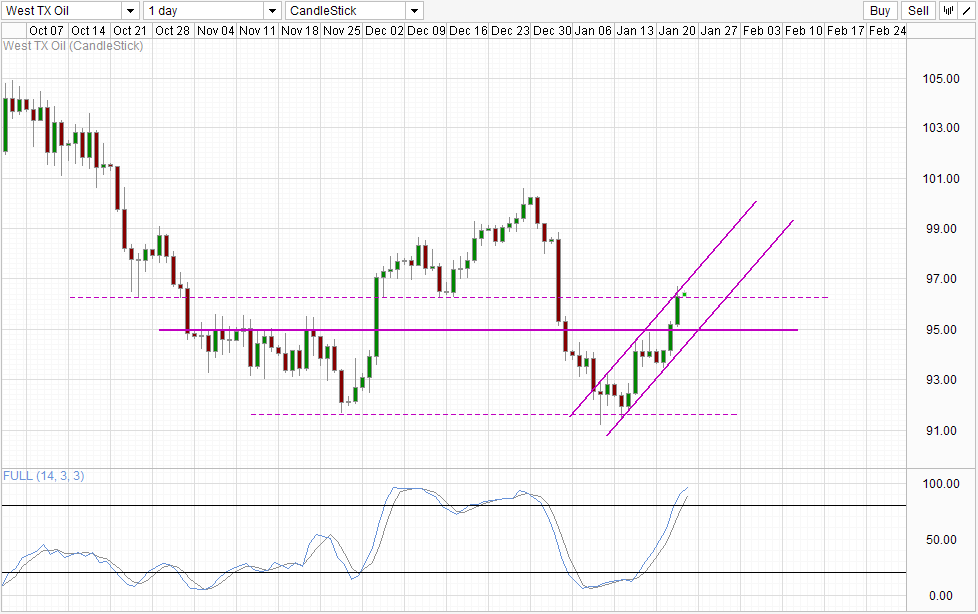
Daily Chart

Daily Chart shows that price is in a strong bullish uptrend within a rising Channel, but if the Channel is of any relevance, we could be seeing limited growth upwards and the likelihood of a pullback becomes higher as price would be facing resistance from Channel Top. Price may still be able to straddle Channel Top and slide up higher but 97.0 round figure will add further resistance. Stochastic readings agree with stoch curve currently within the Overbought region and is currently tapering down, suggesting that we are not too far away from a bearish cycle.
So how do we reconcile this with the strong bullish momentum seen on Hourly Chart?
If price does push up beyond 97.0, the bearish pressure seen on Daily Chart will be invalidated, and the swing high of 100.5 will be a viable target with 99.0 as interim resistance. Hence, conservative traders will need to wait for strong confirmation that 97.0 is resolutely broken. Failure to do so, and the long-term bearish outlook will remain. Considering that fundamentals continue to favor lower crude prices, the downside risks are even higher in the long-run, and the bullish momentum that has stalled will stand a far greater risk of trading lower compared to staying sideways.
