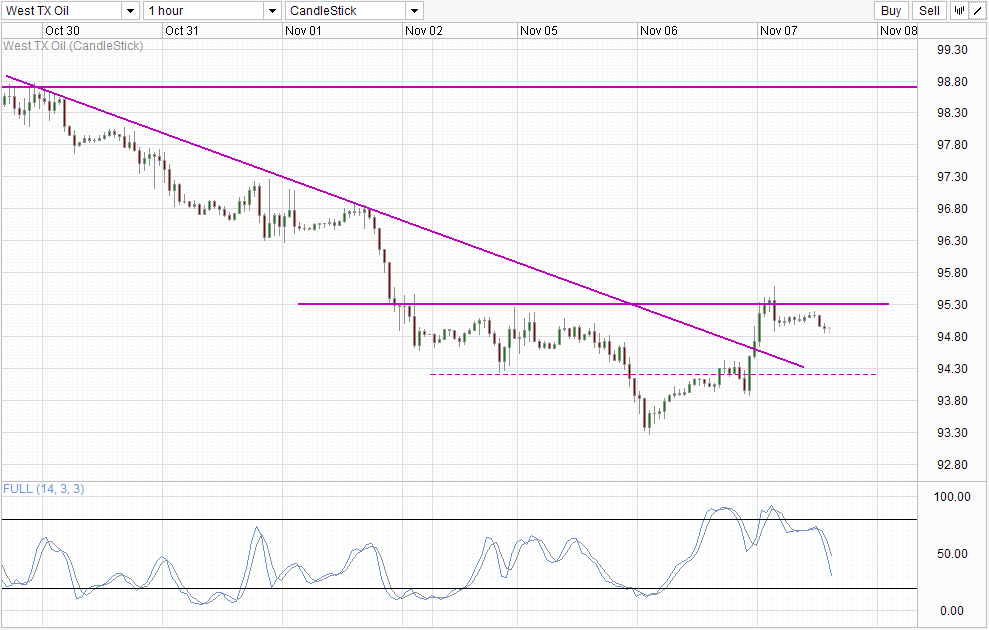
Crude prices rallied higher yesterday following the latest crude inventory data from US Department of Energy. DOE numbers showed an increase of 1.6 million barrels for week ending November 1, slightly lower than analysts consensus estimate of 2.1 million and a huge drop from previous week's 4 million. This lower buildup, together with Tuesday's lower than expected buildup as reflected by numbers from American Petroleum Institute, suggest that the oversupply issue may be easing slightly, resulting in prices rebounding from a 5 month low and hitting a high of 95.6 during US trading session.
Hourly Chart
However, it should be noted that the oversupply situation remains, as the number of consecutive weekly inventory buildup now stands at 7. Even though this week's 1.6 million barrels increase is way below current weekly average of 4.7 million, the new average is still at 4.25 million barrels, much higher than the 8 week and 10 week streak average of under 3 million and 4 million respectively which was discussed yesterday. Therefore, while the problem of oversupply has eased, we are still a far way from seeing supply/demand restabilizing. Furthermore, even if the problem of oversupply has been fully eradicated, this will not be a valid reason for price rallying, but merely resulting in the lack of further bearish movements. Hence it will not be unreasonable to say that a long-term bullish push will not be happening anytime soon.
This notion is reflected in price action as well, where prices have found resistance around 95.3, the top end of the consolidation channel found on Monday/Tuesday. Without breaking the resistance, overall bearish bias remain intact, and the 94.2 opens up as the immediate bearish target. Stochastic readings agree with price within a bearish cycle currently, readings are also rather close to the Oversold region as well - suggesting that additional bearish movement beyond 94.2 may be difficult.
Weekly Chart
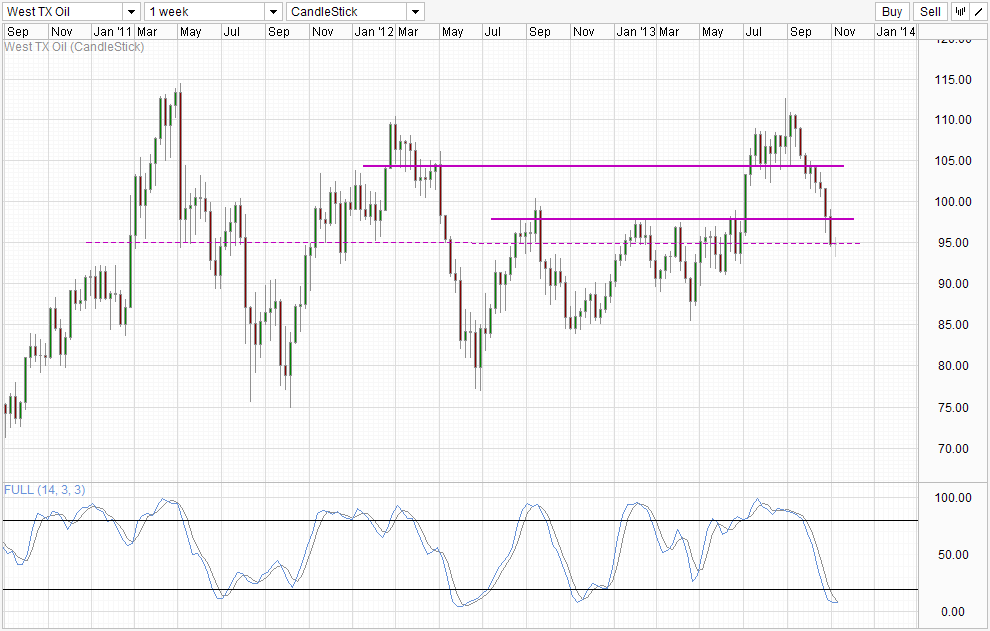
Weekly Chart is mixed though. Even though current momentum is undoubtedly bearish, the magnitude of this current bearish decline without any significant bullish pullback in between suggest that a bullish recovery may be due very soon. Right now, stochastic readings suggest that bearish momentum is already under threat with Stoch curve looking likely to cross the Signal line, while price action is showing a long legged Doji. This in itself does not mean that a bullish reversal is happening, just that current bearish momentum is uncertain, giving bulls the opportunity to seize initiative.
But that is from a pure technical perspective, with fundamentals for crude oil demand continuing looking weak, it is difficult to establish a firm bullish narrative. Nonetheless, we could still see technical pullbacks which can potentially bring us back towards 98.0 resistance. The failure to break 98.0 would be a strong bearish confirmation and we could see stronger bearish momentum arising from there with bears who were still staying on the sideline able to enter the market knowing that the inevitable bullish pullback has already occurred.
Original post
- English (UK)
- English (India)
- English (Canada)
- English (Australia)
- English (South Africa)
- English (Philippines)
- English (Nigeria)
- Deutsch
- Español (España)
- Español (México)
- Français
- Italiano
- Nederlands
- Português (Portugal)
- Polski
- Português (Brasil)
- Русский
- Türkçe
- العربية
- Ελληνικά
- Svenska
- Suomi
- עברית
- 日本語
- 한국어
- 简体中文
- 繁體中文
- Bahasa Indonesia
- Bahasa Melayu
- ไทย
- Tiếng Việt
- हिंदी
WTI Crude: Higher But Short Term Bearish Pressure Remains
Published 11/07/2013, 04:50 AM
Updated 07/09/2023, 06:31 AM
WTI Crude: Higher But Short Term Bearish Pressure Remains
Latest comments
Loading next article…
Install Our App
Risk Disclosure: Trading in financial instruments and/or cryptocurrencies involves high risks including the risk of losing some, or all, of your investment amount, and may not be suitable for all investors. Prices of cryptocurrencies are extremely volatile and may be affected by external factors such as financial, regulatory or political events. Trading on margin increases the financial risks.
Before deciding to trade in financial instrument or cryptocurrencies you should be fully informed of the risks and costs associated with trading the financial markets, carefully consider your investment objectives, level of experience, and risk appetite, and seek professional advice where needed.
Fusion Media would like to remind you that the data contained in this website is not necessarily real-time nor accurate. The data and prices on the website are not necessarily provided by any market or exchange, but may be provided by market makers, and so prices may not be accurate and may differ from the actual price at any given market, meaning prices are indicative and not appropriate for trading purposes. Fusion Media and any provider of the data contained in this website will not accept liability for any loss or damage as a result of your trading, or your reliance on the information contained within this website.
It is prohibited to use, store, reproduce, display, modify, transmit or distribute the data contained in this website without the explicit prior written permission of Fusion Media and/or the data provider. All intellectual property rights are reserved by the providers and/or the exchange providing the data contained in this website.
Fusion Media may be compensated by the advertisers that appear on the website, based on your interaction with the advertisements or advertisers.
© 2007-2024 - Fusion Media Limited. All Rights Reserved.