Hourly Chart
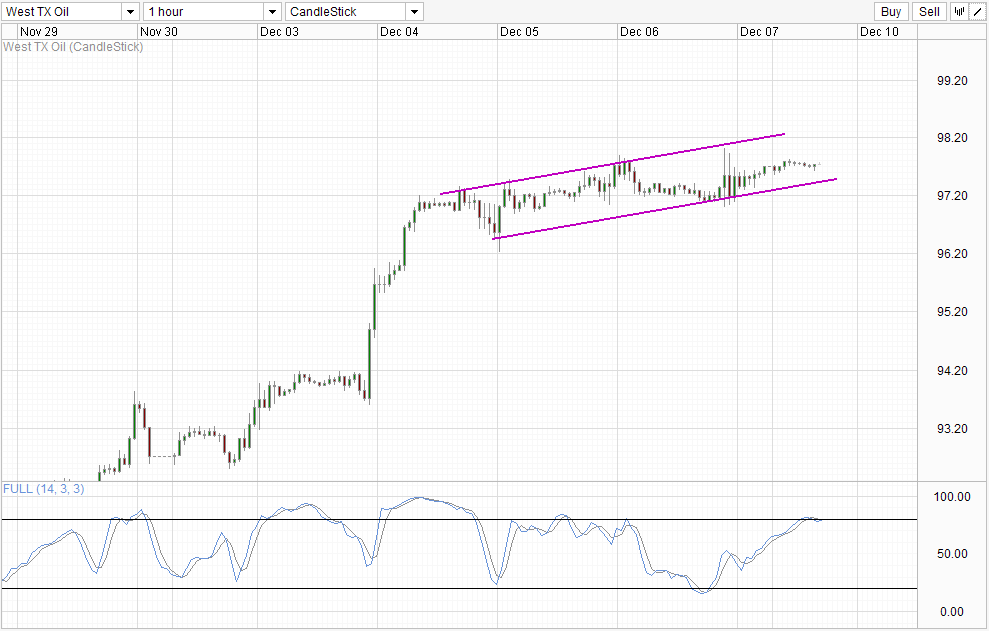
WTI Crude was thought to be bullish after bulls managed to rebuff the pullback attempt on Wednesday, with prices staying afloat mostly above 97.20 for an extended period after the recovery from the bearish pullback. It is interesting to note that prices stayed up despite risk aversion during the same period where S&P 500 and US stocks were trading lower. This was another bullish tick in WTI Crude's favor, underlining the strong bullish sentiment of Crude.
However, all these bullishness came to naught last Friday. Even though the bullish reaction post NFP of USD, US Stocks and Gold is perplexing, there was positive risk appetite across markets - all except for WTI Crude that is. Prices reacted meekly and struggled to push beyond the latest swing high formed on Thursday. We were trading marginally higher this morning, but even then prices have moved lower in equal magnitude, threatening to push below the opening levels just hours before.
Currently Stochastic readings suggest that bullish momentum is over with Stoch curve pushing below the 80.0 level. However, a full on bearish cycle isn't clear, and Stoch curve should push lower beyond 70.0 "support" as a show of stronger bearish conviction. It is likely that prices would be below Channel Bottom as well, increasing the likelihood of a significant bearish follow-through that may take us to 96.20.
Weekly Chart
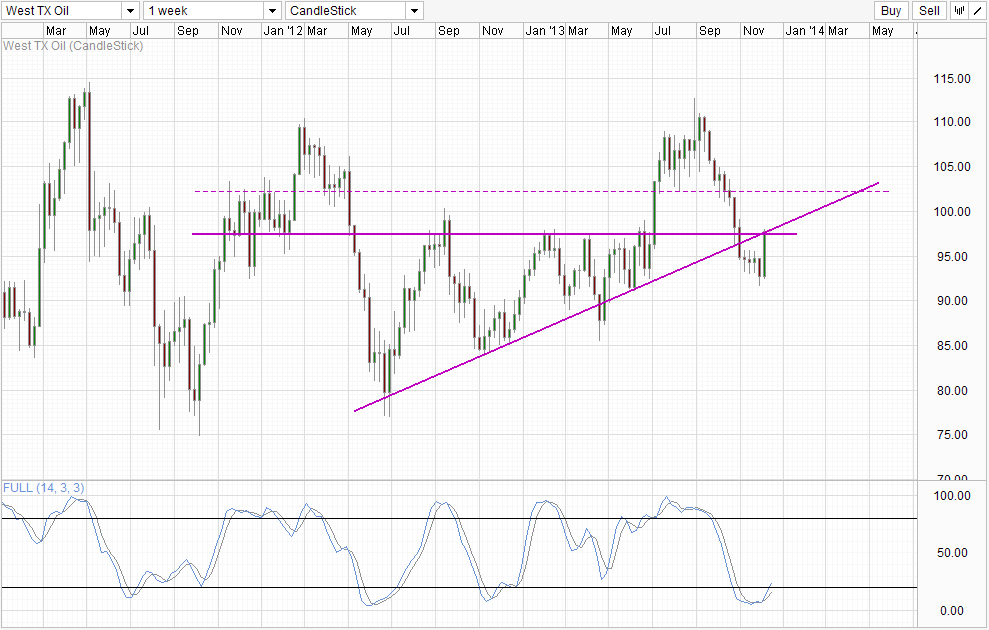
Weekly Chart shows prices heading headlong into the confluence between rising trendline and 97.5 resistance. It is definitely too early to tell whether price will rebound lower or break the combined resistance as the first US trading session this week has not even started. Stochastic readings favors continued bullish push with Stoch curve pushing beyond the 20.0 mark. Price action concur as well, as price will remain mildly bullish above 97.5 even if we trade below the rising trendline. Hence, even if price stays flat for the next few weeks but maintain above 97.5, we could still see a retest of rising trendline eventually.
However, fundamentals do not really support long-term rally for WTI Crude. The demand for Oil isn't increasing, and the 2014 global growth outlook has been revised lower and lower in 2013. Current rally is not a reflection of improving economic fundamentals, but rather a short-term reprieve as reflected in an improvement in the oversupply/under demand situation that has sent prices from above 112.5 to a low of 91.7 in the span of 13 weeks. This is not saying that price will not be able to climb higher from here, but rather we need to note that it would be sentiment/speculation alone that is driving prices higher - a move that is not sustainable and will have strong bearish repercussions in the future.
Original post
- English (UK)
- English (India)
- English (Canada)
- English (Australia)
- English (South Africa)
- English (Philippines)
- English (Nigeria)
- Deutsch
- Español (España)
- Español (México)
- Français
- Italiano
- Nederlands
- Português (Portugal)
- Polski
- Português (Brasil)
- Русский
- Türkçe
- العربية
- Ελληνικά
- Svenska
- Suomi
- עברית
- 日本語
- 한국어
- 简体中文
- 繁體中文
- Bahasa Indonesia
- Bahasa Melayu
- ไทย
- Tiếng Việt
- हिंदी
WTI Crude: Bulls Disappointing As Bears Threaten To Take Over
Published 12/09/2013, 04:52 AM
Updated 07/09/2023, 06:31 AM
WTI Crude: Bulls Disappointing As Bears Threaten To Take Over
Latest comments
Loading next article…
Install Our App
Risk Disclosure: Trading in financial instruments and/or cryptocurrencies involves high risks including the risk of losing some, or all, of your investment amount, and may not be suitable for all investors. Prices of cryptocurrencies are extremely volatile and may be affected by external factors such as financial, regulatory or political events. Trading on margin increases the financial risks.
Before deciding to trade in financial instrument or cryptocurrencies you should be fully informed of the risks and costs associated with trading the financial markets, carefully consider your investment objectives, level of experience, and risk appetite, and seek professional advice where needed.
Fusion Media would like to remind you that the data contained in this website is not necessarily real-time nor accurate. The data and prices on the website are not necessarily provided by any market or exchange, but may be provided by market makers, and so prices may not be accurate and may differ from the actual price at any given market, meaning prices are indicative and not appropriate for trading purposes. Fusion Media and any provider of the data contained in this website will not accept liability for any loss or damage as a result of your trading, or your reliance on the information contained within this website.
It is prohibited to use, store, reproduce, display, modify, transmit or distribute the data contained in this website without the explicit prior written permission of Fusion Media and/or the data provider. All intellectual property rights are reserved by the providers and/or the exchange providing the data contained in this website.
Fusion Media may be compensated by the advertisers that appear on the website, based on your interaction with the advertisements or advertisers.
© 2007-2024 - Fusion Media Limited. All Rights Reserved.