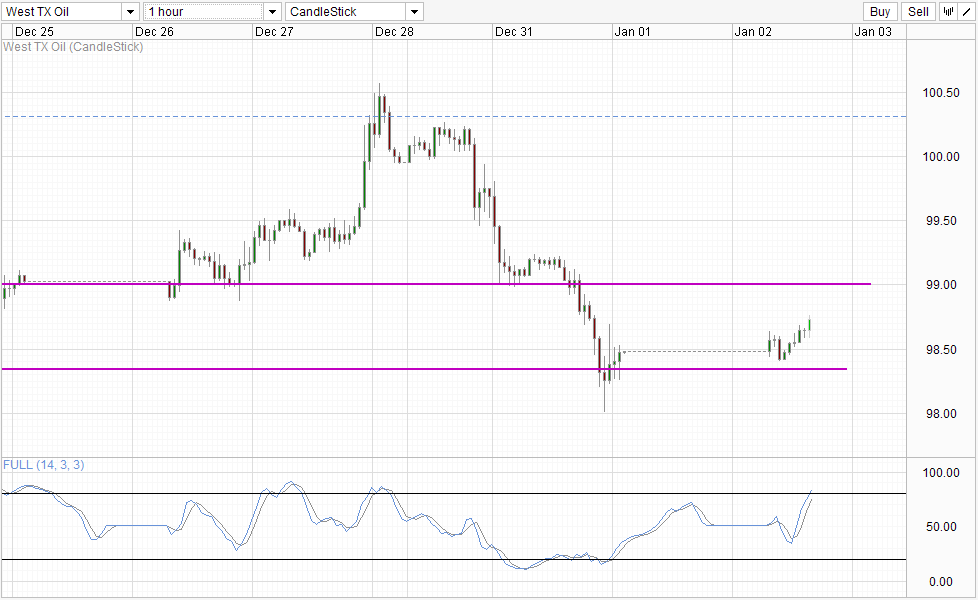
US Crude climbed higher today following inventory data from the American Petroleum suggest that implied demand for crude has risen once again, with the API report reporting a decline of 5.7 million barrels last week versus analysts consensus estimate of a 2.8 million decline. Currently, prices have climbed to a high of 98.7, rebuffing bearish pressure which came from weaker than expected Chinese Manufacturing PMI numbers which managed to push Asian stock prices lower. This suggests that this bullish momentum is strong, and we should be seeing some more bullish extension during European and US trading sessions today if all things remain the same (e.g. no surprise bearish announcements that may affect risk appetite).
Hourly Chart
However, it should be noted that for what it's worth, current bullish endeavour pales in comparison to the huge decline seen at the start of this week. We are still quite a distance away from the round figure resistance at 99.0, and yet momentum indicated by Stochastics suggests that we are already Overbought. Without breaking 99.0, it is hard to imagine the current push as anything beyond a short-term correction, and that assertion would be correct given that prices have actually started pulling back before the API numbers were released, and the bullish reaction during the initial pullback was much stronger compared to the post API reaction, lending credence to the assertion that the current move may simply be a correction rather than a fresh bullish push.
If the above mentioned is correct, then the likelihood of 99.0 holding becomes higher, which would also imply that the decline that started early this week remains in play, and there is a risk that prices may even revert lower from here without testing 99.0.
Weekly Chart
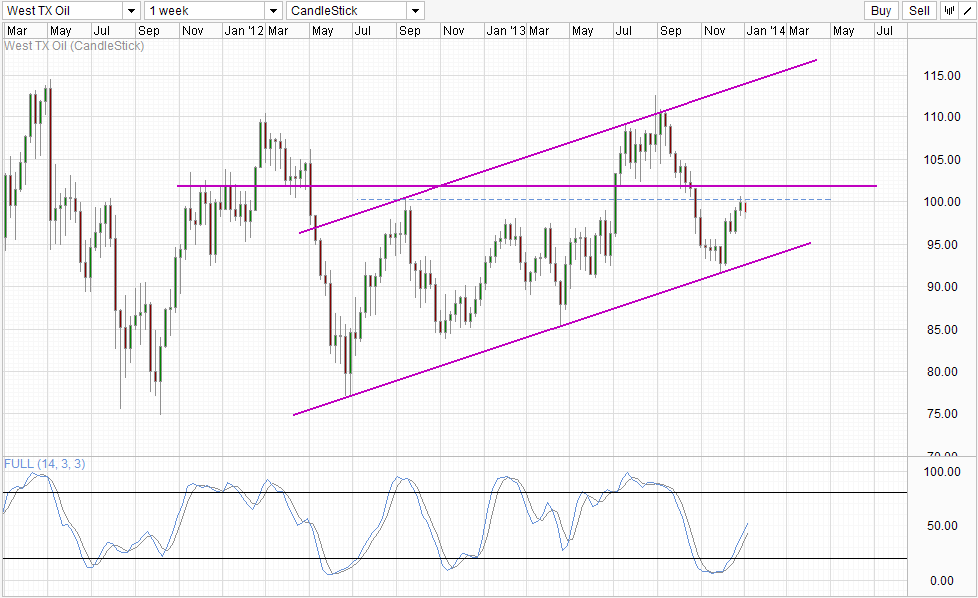
the long-term chart is mixed. On the one hand, one can construct a bullish outlook based on a Channel Bottom rebound in conjunction with Stochastic readings in the midst of a bullish cycle. If this interpretation is correct, a move towards the Channel Top or at the very least close to 110.0 based on current Stoch levels is possible. However, things are not so clear cut with the 100 - 102 resistance band in the way. This wouldn't necessarily mean that price will not be able to push up much higher in the long run, but right now it is hard to formulate a long-term bullish narrative.China and India, two of the largest manufacturing economies, remain weak. Global consumption of crude is expected to fall, and this already forced OPEC to slow down production back in late 2013. Furthermore, production from the US has been increasing steadily for both economic and political reasons. As such, it is hard to imagine Crude being able to climb much further from here.
Taking a step back, it is clear that WTI prices rallying in the month of December has to do with the decline in Crude inventory, breaking the 10 week consecutive chain of inventory build up. This decline cannot be considered surprising, as there's a seasonal tendency in December for inventory to go lower (lower production and higher consumption). The only real surprise was the magnitude with which inventory has declined, but that could simply be interpreted as a temporary pullback following the stupendous 10 week run earlier. Hence, traders who believe that the oversupply/under-demand situation has reversed may wish to hold on a few weeks longer to confirm this belief. From a technical point of view, it is likely that price should have either broken the 100 - 102 resistance band or reverted lower from here in a few weeks, hence we would also have technical confirmation of price direction; Aperfect recipe for a strong directional push to follow.
Original post
- English (UK)
- English (India)
- English (Canada)
- English (Australia)
- English (South Africa)
- English (Philippines)
- English (Nigeria)
- Deutsch
- Español (España)
- Español (México)
- Français
- Italiano
- Nederlands
- Português (Portugal)
- Polski
- Português (Brasil)
- Русский
- Türkçe
- العربية
- Ελληνικά
- Svenska
- Suomi
- עברית
- 日本語
- 한국어
- 简体中文
- 繁體中文
- Bahasa Indonesia
- Bahasa Melayu
- ไทย
- Tiếng Việt
- हिंदी
WTI Crude: Bullish API Unable To Inspire Stronger Outcome
ByMarketPulse
AuthorMingze Wu
Published 01/02/2014, 04:40 AM
WTI Crude: Bullish API Unable To Inspire Stronger Outcome
Latest comments
Loading next article…
Install Our App
Risk Disclosure: Trading in financial instruments and/or cryptocurrencies involves high risks including the risk of losing some, or all, of your investment amount, and may not be suitable for all investors. Prices of cryptocurrencies are extremely volatile and may be affected by external factors such as financial, regulatory or political events. Trading on margin increases the financial risks.
Before deciding to trade in financial instrument or cryptocurrencies you should be fully informed of the risks and costs associated with trading the financial markets, carefully consider your investment objectives, level of experience, and risk appetite, and seek professional advice where needed.
Fusion Media would like to remind you that the data contained in this website is not necessarily real-time nor accurate. The data and prices on the website are not necessarily provided by any market or exchange, but may be provided by market makers, and so prices may not be accurate and may differ from the actual price at any given market, meaning prices are indicative and not appropriate for trading purposes. Fusion Media and any provider of the data contained in this website will not accept liability for any loss or damage as a result of your trading, or your reliance on the information contained within this website.
It is prohibited to use, store, reproduce, display, modify, transmit or distribute the data contained in this website without the explicit prior written permission of Fusion Media and/or the data provider. All intellectual property rights are reserved by the providers and/or the exchange providing the data contained in this website.
Fusion Media may be compensated by the advertisers that appear on the website, based on your interaction with the advertisements or advertisers.
© 2007-2025 - Fusion Media Limited. All Rights Reserved.
