Hourly Chart
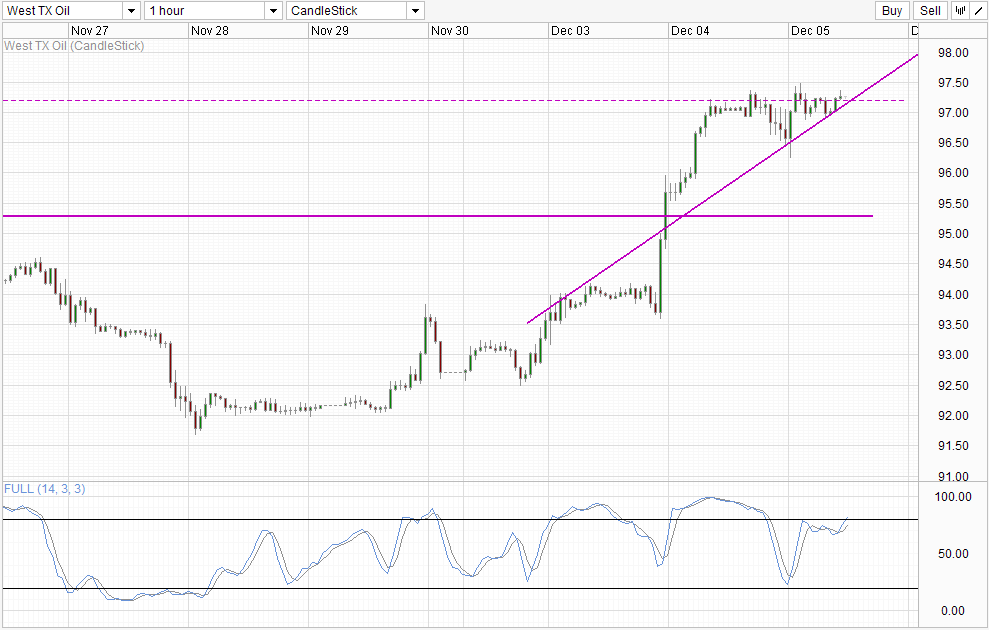
And the numbers are in! Latest inventory numbers from Department of Energy showed a first decline in Crude Stocks in 11 weeks, and what a decline it was - 5.59 million barrels in total, more than 11 times than what analysts expected. However, WTI prices did not rise despite this stronger implied demand, as prices were already highly inflated following API's numbers on Tuesday and bullish hysteria arising from the Keystone pipeline announcement. Hence, any number that is below 12.0 million was expected to illicit a bearish response, and in this regard WTI prices reacted just as we expected.
What is not expected is how prices actually recovered after the post DOE numbers fall, as risk appetite was actually bearish during the period with S&P 500 falling heavily during the same time. Price even managed to push beyond the previous swing high, hitting a new high of 97.47, underlining the strong bullish sentiment of WTI right now.
Daily Chart
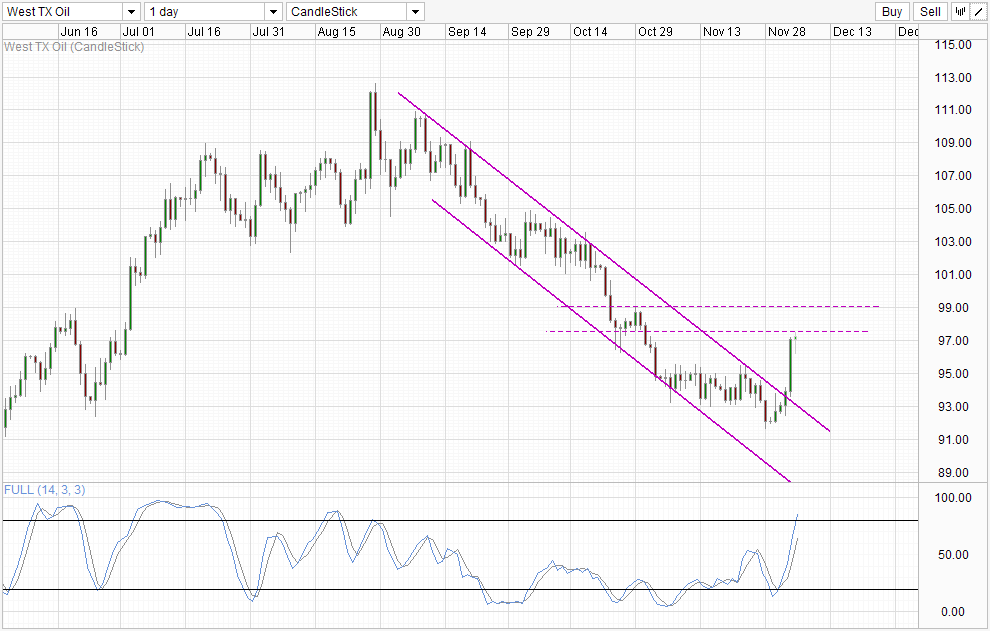
However, bulls may find it hard to find further headway with 97.5 resistance directly overhead right now. Furthermore, Stochastic readings of both Daily Chart and Hourly Chart are within the Overbought region, favoring a bearish pullback. Also, there are hints that bulls may have overreacted to the Keystone pipeline news as mentioned in our analysis yesterday, increasing the likelihood of a strong bearish backlash especially if risk appetite remain bearish in the next few days. Nonetheless, should prices manage to break 97.5, there is a real possibility of push towards 99.0, but beyond 99.0 will be difficult to contemplate within the next few trading days with QE Taper uncertainty looming 2 weeks later.
Original post
- English (UK)
- English (India)
- English (Canada)
- English (Australia)
- English (South Africa)
- English (Philippines)
- English (Nigeria)
- Deutsch
- Español (España)
- Español (México)
- Français
- Italiano
- Nederlands
- Português (Portugal)
- Polski
- Português (Brasil)
- Русский
- Türkçe
- العربية
- Ελληνικά
- Svenska
- Suomi
- עברית
- 日本語
- 한국어
- 简体中文
- 繁體中文
- Bahasa Indonesia
- Bahasa Melayu
- ไทย
- Tiếng Việt
- हिंदी
WTI Crude: 97.5 Capping Gains Despite Strong Bullish Sentiment
Published 12/05/2013, 01:32 AM
Updated 07/09/2023, 06:31 AM
WTI Crude: 97.5 Capping Gains Despite Strong Bullish Sentiment
Latest comments
Loading next article…
Install Our App
Risk Disclosure: Trading in financial instruments and/or cryptocurrencies involves high risks including the risk of losing some, or all, of your investment amount, and may not be suitable for all investors. Prices of cryptocurrencies are extremely volatile and may be affected by external factors such as financial, regulatory or political events. Trading on margin increases the financial risks.
Before deciding to trade in financial instrument or cryptocurrencies you should be fully informed of the risks and costs associated with trading the financial markets, carefully consider your investment objectives, level of experience, and risk appetite, and seek professional advice where needed.
Fusion Media would like to remind you that the data contained in this website is not necessarily real-time nor accurate. The data and prices on the website are not necessarily provided by any market or exchange, but may be provided by market makers, and so prices may not be accurate and may differ from the actual price at any given market, meaning prices are indicative and not appropriate for trading purposes. Fusion Media and any provider of the data contained in this website will not accept liability for any loss or damage as a result of your trading, or your reliance on the information contained within this website.
It is prohibited to use, store, reproduce, display, modify, transmit or distribute the data contained in this website without the explicit prior written permission of Fusion Media and/or the data provider. All intellectual property rights are reserved by the providers and/or the exchange providing the data contained in this website.
Fusion Media may be compensated by the advertisers that appear on the website, based on your interaction with the advertisements or advertisers.
© 2007-2024 - Fusion Media Limited. All Rights Reserved.