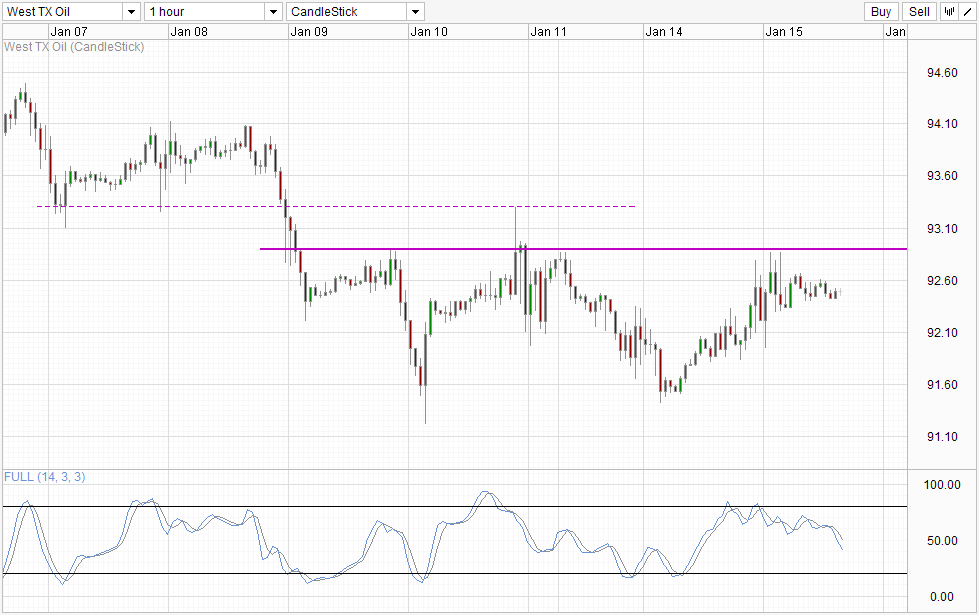
Crude Oil prices rebounded from Monday's low, led by positive risk appetite during late Asian/early European hours. Risk appetite was further fuelled by yesterday's stronger than expected US Advance Retail Sales, sending WTI more than $1 per barrel higher from peak to trough. However, prices failed to test the ceiling of 93.0 in any significant manner, not to mention overcoming it. Hence, the subsequent bearish-pullback post US noon is understandable given the bullish failure. Luckily for bulls, the bearish decline was arrested at the closing hour of the US stock market due to the American Petroleum Institute weekly report which reflected a 4.14 million fall in Crude Inventories - suggesting that implied demand is higher as analysts only expect a decline of 1.3 million barrels in today's Department of Energy numbers.
Hourly Chart

However, for what it's worth, the bullish API numbers did not manage to send WTI prices back to previous highs. Similarly, continued risk-on appetite during the Asian session this morning and the current European stock rallies were still unable to move prices much higher. Instead, it seems that the bearish rejection of the 93.0 round figure remains in play, and Stochastic readings agree with the Stoch curve currently pointing sharply lower. Obvious bearish targets from here will be the 91.2 - 91.5 swing lows formed last week. Considering that the current bearish push seems to be technically driven, it is unlikely that price will be able to go down much further beyond 91.2, especially since Stochastic readings will be deeply Oversold should that happen.
To a lesser extent, the possibility of a push toward the 93.0 round figure remains open. The stochastic curve is facing its own "support" just below 50.0, based on previous points of inflexion in the past week. Hence, it will not be surprising to see the stoch curve reversing and prices pointing higher.
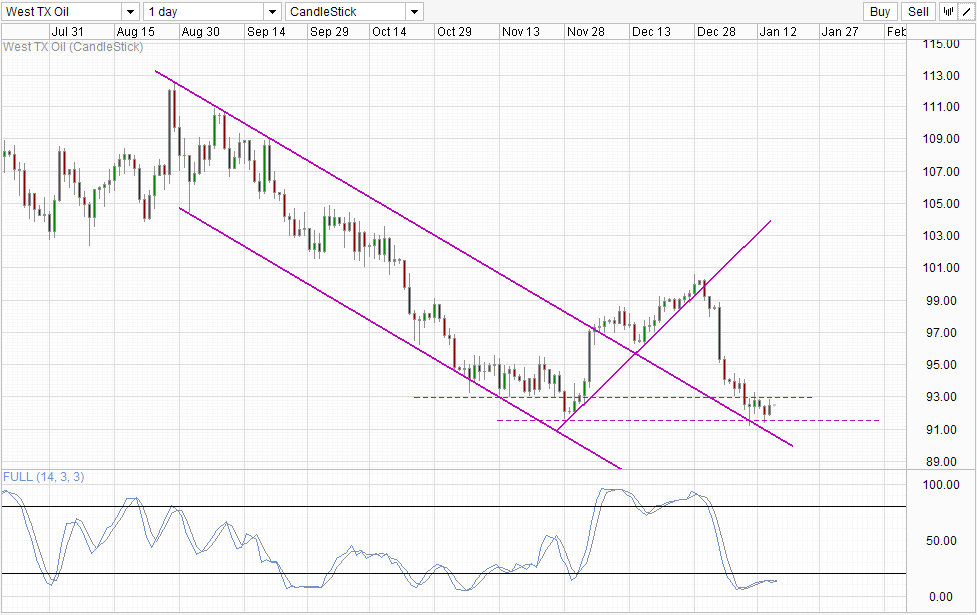
Daily Chart
The Daily Chart is clearly bearish though, which is in line with the overwhelming bearish fundamentals, but a rebound from 91.5 heading towards 93.0 cannot be ruled out as well, since a substantial bullish pullback is still missing, since the great slide from 100.0. Furthermore, Stochastic readings remain within the Oversold region, awaiting a more significant bullish recovery. From a price action perspective, bulls have not really tested 93.0 either, hence we cannot really say that a bearish rejection of 93.0 has occurred. All this doesn't mean that prices will definitely trade higher, just that the likelihood of a recovery is a tad higher than what the overbearing bearish pressure from the highs of August 2013 may suggest.
Post the DOE report, movement will be helpful for us to determine the likelihood of a 93.0 test. Should price continue to stay buoyant despite a print lower than the API numbers, the likelihood of a test of 93.0 increases. Similarly, if the DOE numbers are more bullish than API but Crude continues to stay flat/lower, the likelihood of a 91.5 move from here increases, and we could even see a further bearish push lower to hit the Channel Bottom.
