There’s a tendency in the financial media to wrap-up calendar years with a focus on the “winners” and “losers.” Inevitably, a large number of unsophisticated investors will allocate money to the so-called best performers, while avoiding any commitment to the underachievers.
Herein lies one of the biggest mistakes that ETF enthusiasts make. Specifically, they view success through a prism of calendar-year data, ignoring genuine momentum found in relative strength or price ratios or even May-over-May performance. In fact, a calendar-year obsession has enormous potential to mislead.
Keep in mind, it’s not uncommon for worst performers in one year to reverse course entirely. In 2011, iShares MSCI Turkey (TUR) lost a staggering -36.6%. In 2012? The iShares MSCI Turkey Fund (TUR) was one of the best unleveraged ETF performers with an eye-popping 65.6% gain.
Recognizing that 2012 “losers” may reverse course in 2013, I identified 3 ETF spaces that may do just that. Each of the asset areas discussed below under-performed broader large-cap equity benchmarks (i.e., S&P 500, MSCI All World) on a year-over-year basis. By the same token, each demonstrated greater relative strength than these benchmarks over the last 5 trading sessions.
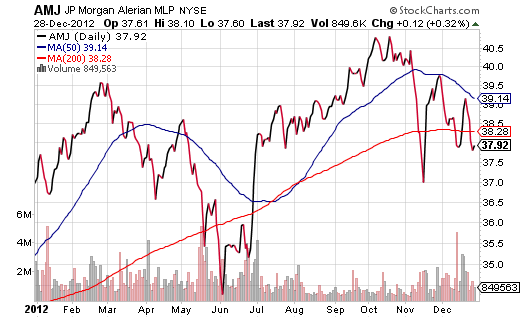
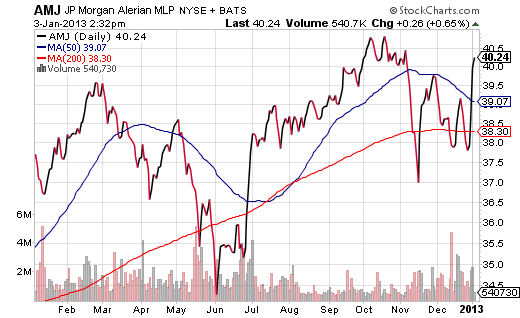
1. Pipeline MLPs. Whether aggregating individual companies via exchange-traded fund or exchange-traded note, pipeline master limited partnerships offer something that few investment types can: about a 5% or better yield with about a 5% average company growth rate. And yet, 2012 was brutally unkind to the pipeline MLPs/energy sector due to falling demand, falling prices, regulatory fear/burden and fiscal cliff dividend tax uncertainty.
As recently as 12/30, JP Morgan Alerian MLP ETN (AMJ) was below a 200-day trendline. A few trading days later (1/3/13), with the “cliff resolution” removing dividend tax uncertainty, things look very different.

This is not to suggest that everything is hunky-dory for the asset class. There is environmental resistance to allowing the Keystone Pipeline to be built. The White House has hinted at additional tax reform in the debt ceiling debate, which may reintroduce uncertainty to the asset class and its structure. Even a 10-year yield that manages to move another 50 basis points higher could threaten a favorable spread (300 basis points). Nevertheless, I would still be intrigued by a minor pullback in funds like Credit Suisse MLP 30 (MLPN) and UBS Alerian MLP Infrastructure (MLPI).
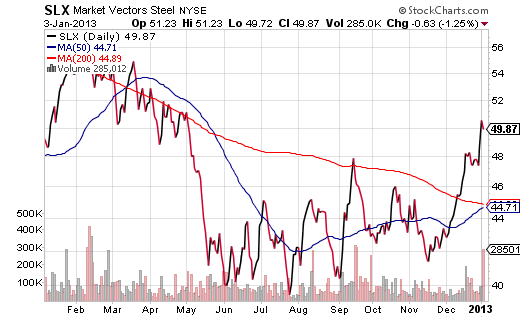
2. Strategic Metals and Industrial Metals. Year-over-year, SPDR Metals and Mining (XME) is down -5%. For believers in hard assets, that’s a particularly jagged pill to swallow. And yet, ever since China announced a steadfast commitment to support 7.5% GDP going forward, accompanied by several months of manufacturing segment expansion, materials and metals have moved steadily higher.
In truth, China is more likely to grow at 8% and its factory sector hasn’t been this strong since May of 2011. With the world’s largest economy being the primary engine for global growth, and with demand for industrial/strategic metals surging, look for the possibility of enhanced capital appreciation. Market Vectors Strategic Metals (REMX) and Market Vectors Steel (SLX) are worthy of placing on your watch list. 
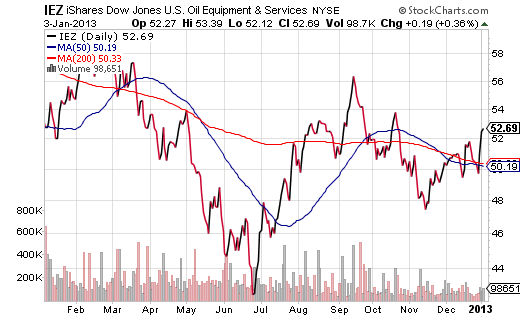
3. Oil Equipment and Services. At first glance, one might view this energy sub-sector in the same vein as Pipeline MLPs. However, the former is engaged primarily in helping other firms produce/acquire fossil fuels while the latter primarily deals with storage and transportation. More importantly, oil equipment/services firms tend to be structured as traditional C corporations whereas MLPs have favorable pass-through partnership structures with no corporate taxation.
Granted, that may sound like a mouthful. What’s more, if the asset types were highly correlated, the differences might not mean a great deal. However, over the last 6 months, iShares DJ Oil and Equipment Services (IEZ) had an exceptionally low correlation coefficient (0.36) with JP Morgan Alerian (AMJ). It follows that energy stock advocates should still be looking at funds like iShares DJ Oil and Equipment Services (IEZ), Market Vectors Oil Services (OIH) and SPDR Oil Gas Equipment and Services (XES).
Disclosure: Gary Gordon, MS, CFP is the president of Pacific Park Financial, Inc., a Registered Investment Adviser with the SEC. Gary Gordon, Pacific Park Financial, Inc, and/or its clients may hold positions in the ETFs, mutual funds, and/or any investment asset mentioned above. The commentary does not constitute individualized investment advice. The opinions offered herein are not personalized recommendations to buy, sell or hold securities. At times, issuers of exchange-traded products compensate Pacific Park Financial, Inc. or its subsidiaries for advertising at the ETF Expert web site. ETF Expert content is created independently of any advertising relationships.
- English (UK)
- English (India)
- English (Canada)
- English (Australia)
- English (South Africa)
- English (Philippines)
- English (Nigeria)
- Deutsch
- Español (España)
- Español (México)
- Français
- Italiano
- Nederlands
- Português (Portugal)
- Polski
- Português (Brasil)
- Русский
- Türkçe
- العربية
- Ελληνικά
- Svenska
- Suomi
- עברית
- 日本語
- 한국어
- 简体中文
- 繁體中文
- Bahasa Indonesia
- Bahasa Melayu
- ไทย
- Tiếng Việt
- हिंदी
Worst ETFs In 2012? They Might Become Winners In 2013
Published 01/04/2013, 02:14 AM
Updated 03/09/2019, 08:30 AM
Worst ETFs In 2012? They Might Become Winners In 2013
Latest comments
Loading next article…
Install Our App
Risk Disclosure: Trading in financial instruments and/or cryptocurrencies involves high risks including the risk of losing some, or all, of your investment amount, and may not be suitable for all investors. Prices of cryptocurrencies are extremely volatile and may be affected by external factors such as financial, regulatory or political events. Trading on margin increases the financial risks.
Before deciding to trade in financial instrument or cryptocurrencies you should be fully informed of the risks and costs associated with trading the financial markets, carefully consider your investment objectives, level of experience, and risk appetite, and seek professional advice where needed.
Fusion Media would like to remind you that the data contained in this website is not necessarily real-time nor accurate. The data and prices on the website are not necessarily provided by any market or exchange, but may be provided by market makers, and so prices may not be accurate and may differ from the actual price at any given market, meaning prices are indicative and not appropriate for trading purposes. Fusion Media and any provider of the data contained in this website will not accept liability for any loss or damage as a result of your trading, or your reliance on the information contained within this website.
It is prohibited to use, store, reproduce, display, modify, transmit or distribute the data contained in this website without the explicit prior written permission of Fusion Media and/or the data provider. All intellectual property rights are reserved by the providers and/or the exchange providing the data contained in this website.
Fusion Media may be compensated by the advertisers that appear on the website, based on your interaction with the advertisements or advertisers.
© 2007-2025 - Fusion Media Limited. All Rights Reserved.
