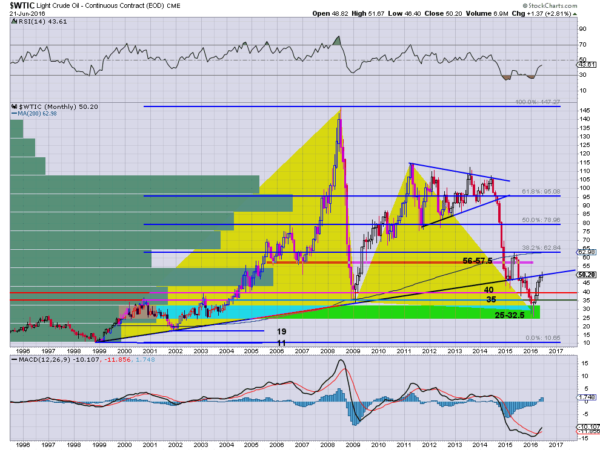
Crude Oil has been moving higher all year. After confirming a bottom on the longer term basis with a double hammer, the move higher has been outstanding. But recently it has stalled. Is that the end for the Crude Oil rally? Or just a digestive stop along the way? Lets take a look.
The chart below shows the reversal at the Potential Reversal Zone (PRZ) of the long term harmonic Bat. The RSI turned higher and the MACD crossed up and is rising. Things look good on the longer term basis. Except for 1 thing. Crude Oil is testing the 20 year rising trend line as resistance. What was once support, now resistance, should illicit a pause. Oh, and this is at the round number 50. Another sticky point.

This is naturally causing consternation among pundits. But on the long term basis, this is a natural pause point. The first target above is to 62.84. This is right at the 200 month SMA. The RSI is continuing higher and the MACD is crossed and rising. The next area of pause might come around the 56-57.5 area.
How long will it take to get through the 50 level? Who knows. And it may pullback in the interim as well. But as long as the monthly candle continues to hold over 46 this is a chart that looks for more upside.
The information in this blog post represents my own opinions and does not contain a recommendation for any particular security or investment. I or my affiliates may hold positions or other interests in securities mentioned in the Blog, please see my Disclaimer page for my full disclaimer.
