Short post, but it’s been one I've thought about for a few weeks.
Municipal bonds have done well since the election, since a Democratic Administration is typically good for additional state and local relief, even more badly needed this year thanks to the pandemic.
Also, it’s pretty clear higher taxes in some form or fashion are on the way, whether it’s corporate tax increases, individual tax rates, or capital gains rates, or some combination of all three.
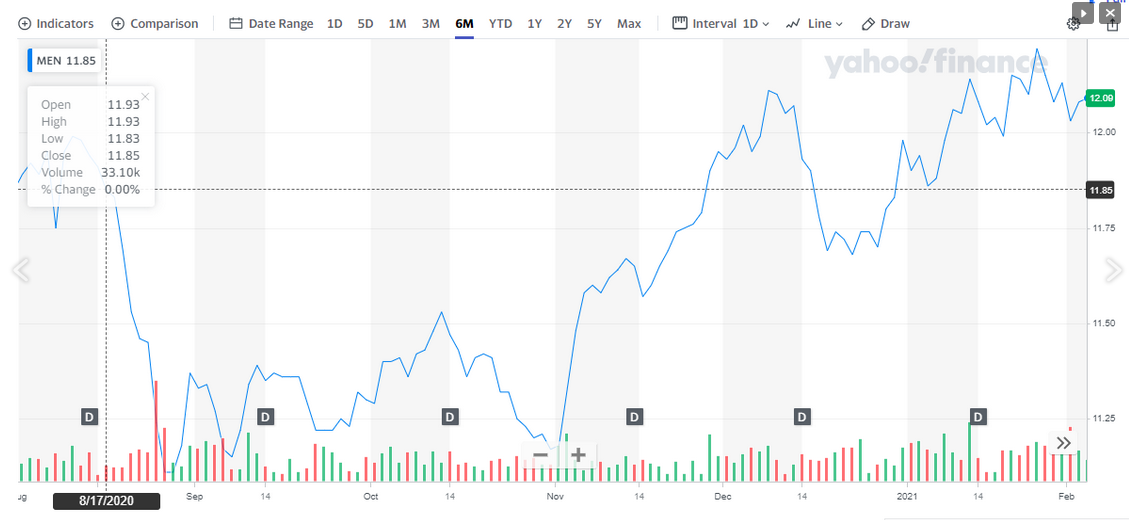
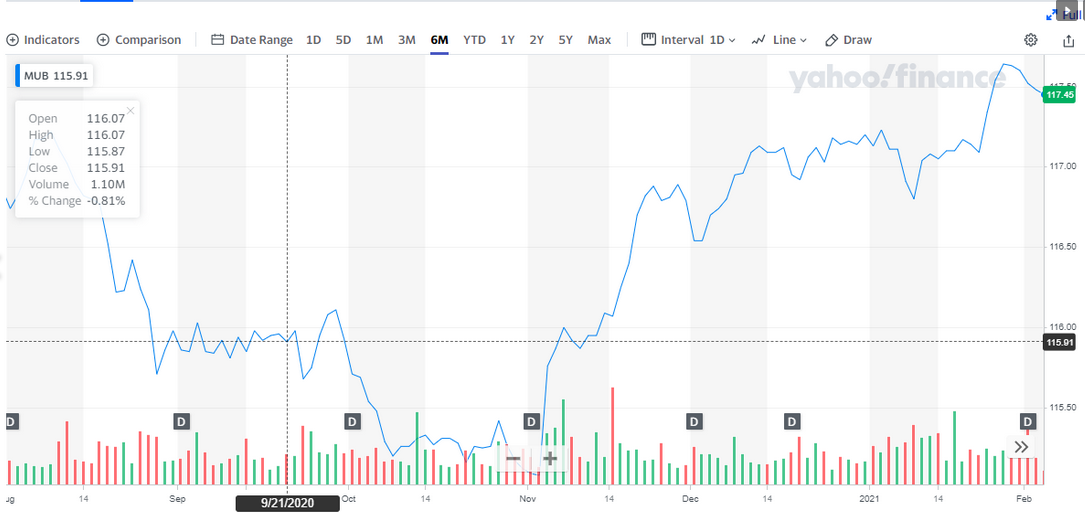
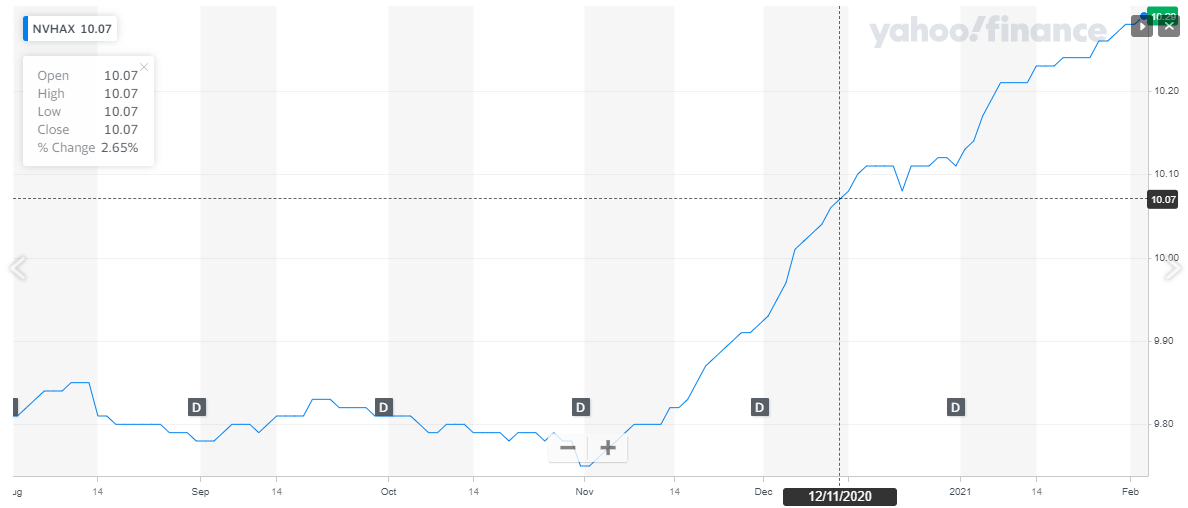
Here are three municipal bond charts from Yahoo Finance. Two ETFs and one mutual fund:

This is the Blackrock MuniEnhanced Fund (NYSE:MEN). It’s trading at a 4.43% discount to NAV, versus the 8% 3-year average.

This is the well known municipal bond fund, the iShares National Muni Bond ETF (NYSE:MUB).

This mutual fund is the Nuveen Shorter-Duration High Yield Bond fund, similar to its longer-duration High Yield bond fund managed by John Miller. John Miller is on the team that managed the shorter-duration fund too. He has an enviable track record.
Summary / conclusion: None of these charts or vehicles is a recommendation to buy or sell these municipal products, although clients are long both the Nuveen longer-duration high yield fund (NHMAX) and now the shorter-duration Nuveen fund (NVHAX) as well. With the 10-year Treasury closing at 1.13% on Wednesday, it continues to creep higher as more fiscal stimulus and a stronger economy look likely in later 2021.
I’m sure too the rise in crude oil and commodity prices like steel are making the inflationistas nervous, but traditionally commodity inflation eventually passes through the inflation indices.
It’s wage inflation that the bond market worries about.
There is one similarity to all the above charts that readers should note: all three bottomed on November 3rd, 2020, or election day. The Georgia Runoff Senate vote helped too (.i.e swinging the Senate to the Democrats), but this probably insures that we get higher taxes in some form or fashion at some point either later this year or next year. An increase in ordinary income tax rates will likely increase demand for muni’s tax-exempt income.
Funny too, I’m not reading a lot about this in the mainstream financial media.
A trade up to 1.20% for the 10-year Treasury yield and it puts the yield at a 1-year high.
The last time munis were owned for clients of any size was 2013, with the Bernanke Taper Tantrum and then the Detroit City default. The discounts on closed-end muni funds soared to mid-teens or higher, and Detroit scared everyone.
I like the shorter-duration muni high-yield here with budget relief for cities like Chicago and states like Illinois coming from Congress, with the Fed dedicated to keeping fed funds at zero for a while.
Evaluate all information in light of your own financial and risk profile.
