With gold eyeing 1500 (and possibly beyond) as we head into 2020, here are some gold mining stocks which are displaying promising technicals.
With gold eyeing 1500 (and possibly beyond) as we head into 2020, here are some gold mining stocks which are displaying promising technicals.

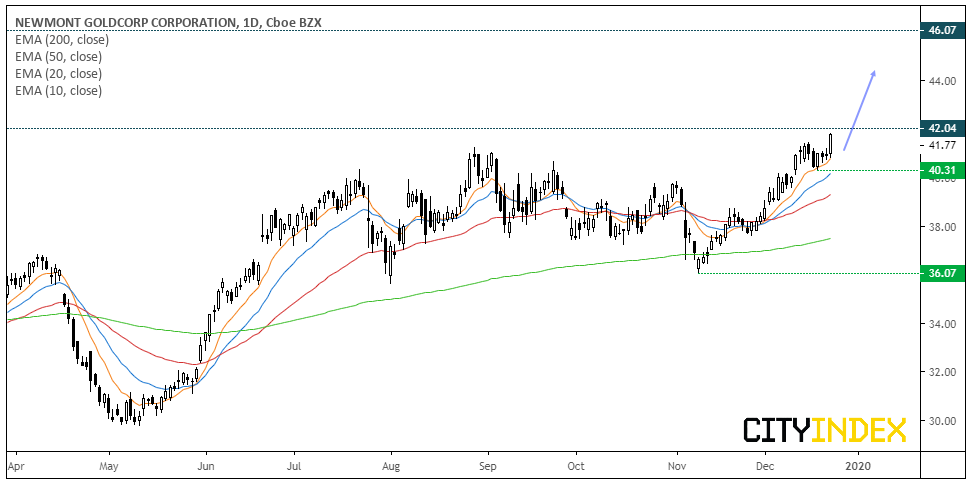
Newmont Goldcorp (NYSE:NEM): Trading just cents below the 2018 high, we’re watching Newmont closely for a bullish breakout. Price action since the 36 low in November has produced a clean, bullish trend with minor pullbacks. The moving average are in bullish sequence and fanning out, which shows increasing momentum across multiple timeframes, and the 10-day eMA is now acting as support.
Bias remains bullish above 40.31 and for a run towards the 46 high.

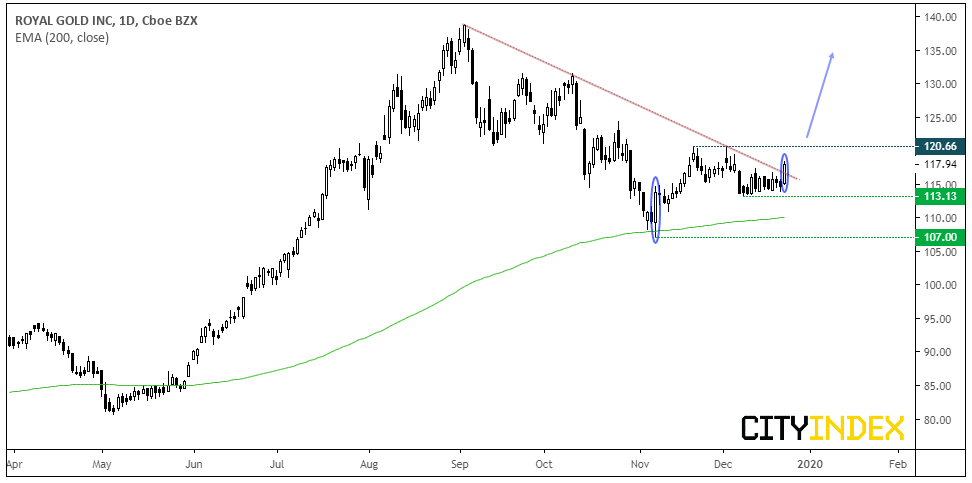
Royal Gold (NASDAQ:RGLD): We may well have seen the end of the correction in November, where an elongated bullish engulfing candle sprang higher from the 200-day eMA. It’s also worth noting that yesterday’s bullish close invalidated a bearish trendline on above-average volume to show bulls are taking back control. That it occurred after consolidating above 113 suggests a higher low could be in place.

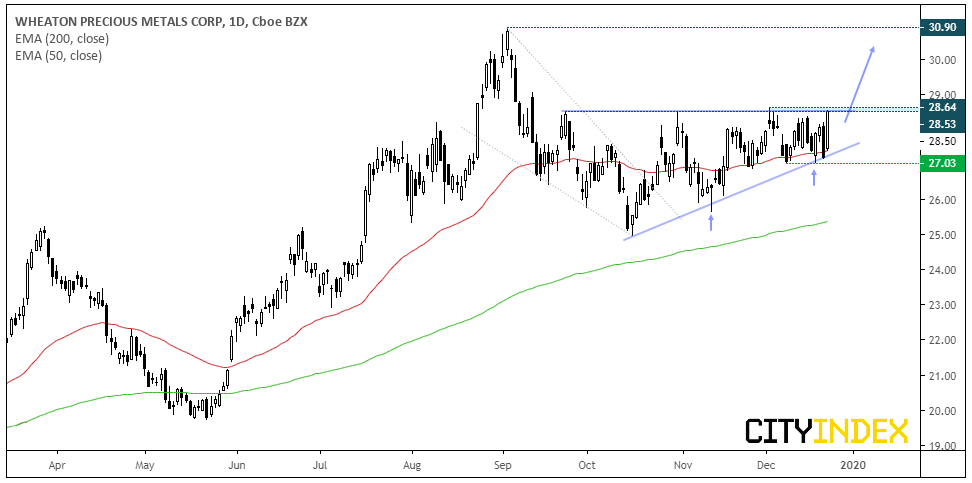
Wheaton Precious Metals (NYSE:WPM): It’s safe to say that the bullish wedge highlighted earlier this year simply did not work out as hoped. Neither did it fail as such, but it really should have hit target by now to call it a success. Still, it is producing higher lows into resistance around 28.60 and could be on the verge of a bullish breakout.

Newmont Goldcorp (NYSE:NEM)): Trading just cents below the 2018 high, we’re watching Newmont closely for a bullish breakout. Price action since the 36 low in November has produced a clean, bullish trend with minor pullbacks. The moving average are in bullish sequence and fanning out, which shows increasing momentum across multiple timeframes, and the 10-day eMA is now acting as support.
Bias remains bullish above 40.31 and for a run towards the 46 high.

Royal Gold (NASDAQ:RGLD): We may well have seen the end of the correction in November, where an elongated bullish engulfing candle sprang higher from the 200-day eMA. It’s also worth noting that yesterday’s bullish close invalidated a bearish trendline on above-average volume to show bulls are taking back control. That it occurred after consolidating above 113 suggests a higher low could be in place.

Wheaton Precious Metals (NYSE:WPM): It’s safe to say that the bullish wedge highlighted earlier this year simply did not work out as hoped. Neither did it fail as such, but it really should have hit target by now to call it a success. Still, it is producing higher lows into resistance around 28.60 and could be on the verge of a bullish breakout.
