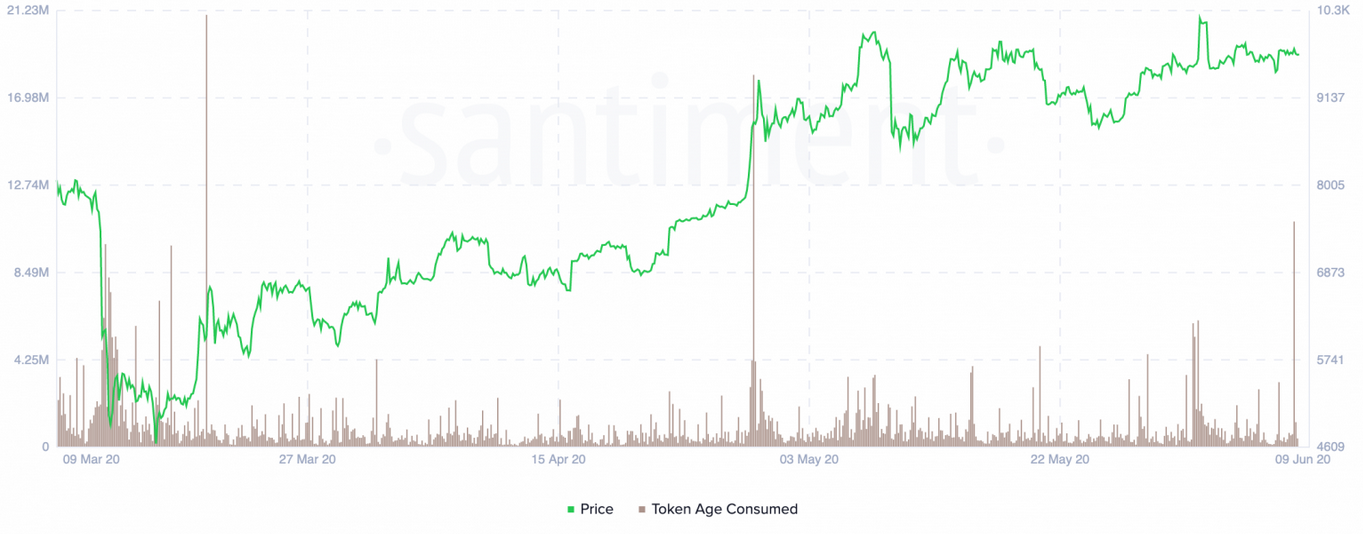
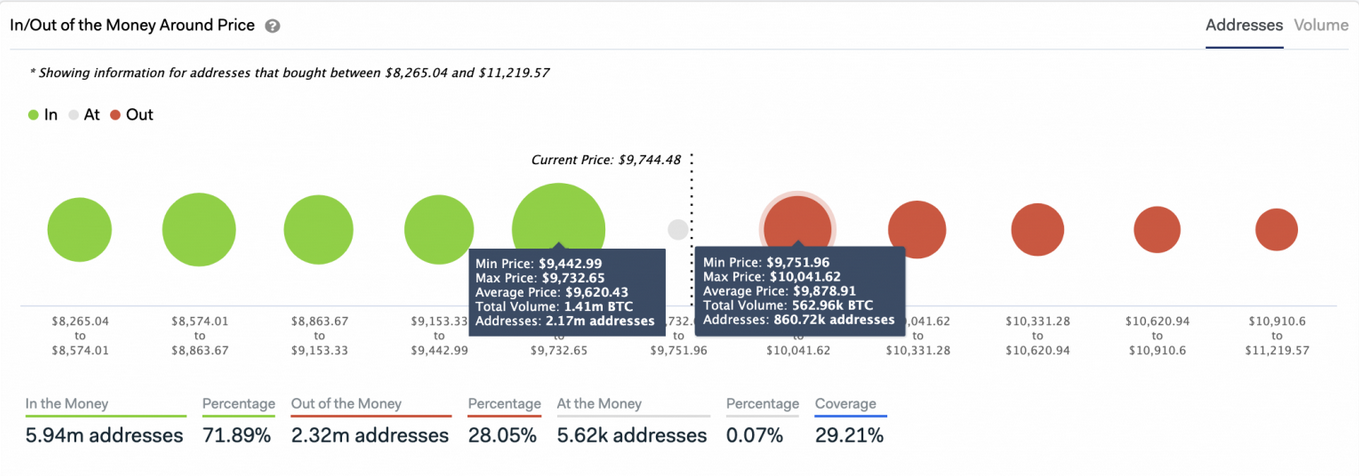
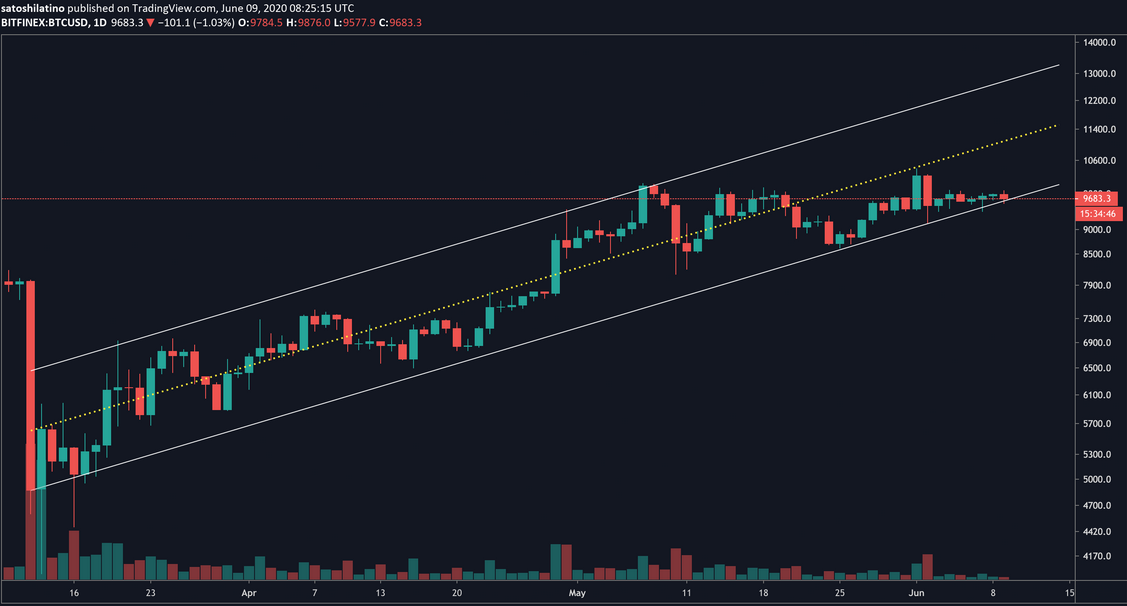
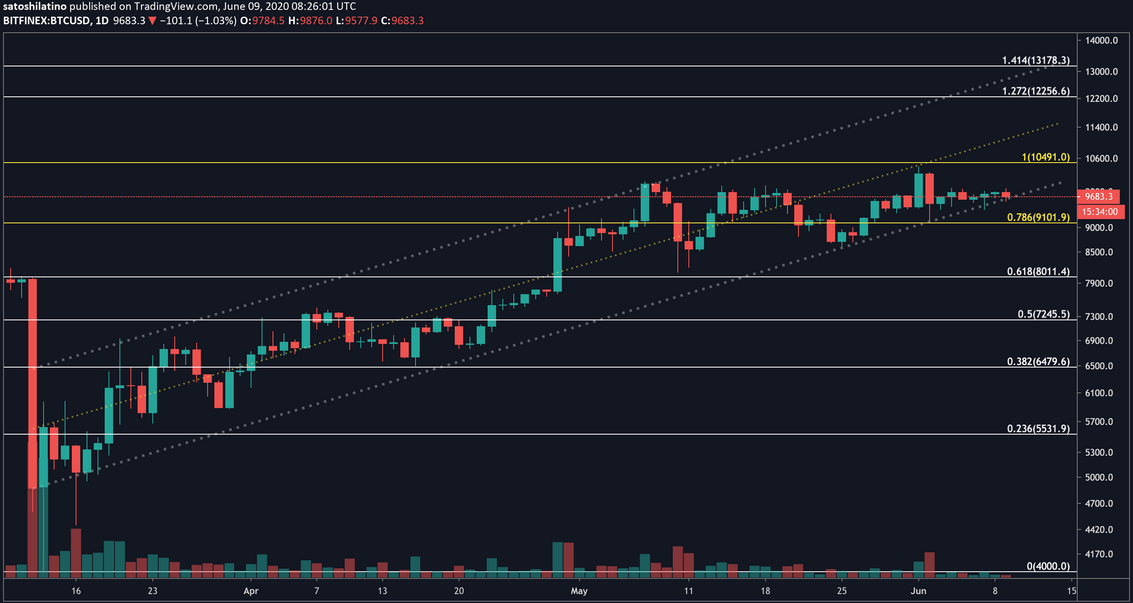
Based on the price history of the past three months, Bitcoin looks ready for high levels of volatility. A significant number of old BTC tokens have changed hands as Bitcoin continues to consolidate within a narrow trading range. Santiment’s Token Age Consumed index has recorded a significant spike in idle Bitcoin now exchanging hands in the past few hours. This on-chain metric measures how many coins have recently moved addresses, multiplied by the number of days since they last moved. Although the movement of old tokens is not necessarily a leading price indicator, there has been a certain level correlation between the two data points over the past three months. Following March’s Black Thursday, for instance, Bitcoin rose to a high of nearly $7,000. During that time, the behavior analytics platform registered a massive amount of idled BTC tokens moving between addresses. After that, the price of the pioneer cryptocurrency plummeted over 18% to hit a low of $5,700. Then, as Bitcoin was rising towards $9,500 in late April, the ratio of old tokens changing hands began to increase. What followed was a 10% retracement that saw BTC move back below $9,000. If history repeats itself, Bitcoin could go through more extreme volatility based on recent token movement. IntoTheBlock’s “In/Out of the Money Around Price” (IOMAP) model suggests that the flagship cryptocurrency sits between critical support and resistance levels. On the upside, approximately 861,000 addresses bought over 560,000 BTC between $9,750 and $10,050. Such a considerable supply wall might contain Bitcoin from posting further gains. But beyond this barrier, there are no other significant hurdles that would prevent BTC from reaching $12,000. Conversely, the $9,400-$9,700 level is a crucial area of support. Here, roughly 2.2 million addresses bought over 1.4 million BTC. This massive support barrier could have the ability to absorb any downward pressure. Breaking through it, however, will be catastrophic for the bulls since it could ignite a sell-off. From a technical perspective, the ascending parallel channel, where the bellwether cryptocurrency has been contained since mid-March, adds credence to the ambiguous outlook. Over the past three months, each time Bitcoin has surged to the upper boundary of this channel, it pulls back to hit the lower boundary, and from this point, it bounces back up again. After the most recent rejection from the middle line of the channel, Bitcoin dropped to the lower boundary. Now, it is reasonable to expect a rebound from this level back to the middle or upper boundary of the channel. It is worth noting that the Fibonacci retracement indicator suggests that if Bitcoin moves past the $9,400-$9,700 support level and breaks below the $9,100, the next areas of support are provided by the 61.8% and 50% Fib. These supply barriers sit at $8,000 and $7,250, respectively. As high levels of volatility seem to be underway, it is crucial to implement a robust risk management strategy. Understanding the significance of the support and resistance levels mentioned above can help minimize losses and expand opportunities for profit.Key Takeaways
Idled BTC Tokens Are On the Move

Strong Support and Resistance

An Ambiguous Outlook


- English (UK)
- English (India)
- English (Canada)
- English (Australia)
- English (South Africa)
- English (Philippines)
- English (Nigeria)
- Deutsch
- Español (España)
- Español (México)
- Français
- Italiano
- Nederlands
- Português (Portugal)
- Polski
- Português (Brasil)
- Русский
- Türkçe
- العربية
- Ελληνικά
- Svenska
- Suomi
- עברית
- 日本語
- 한국어
- 简体中文
- 繁體中文
- Bahasa Indonesia
- Bahasa Melayu
- ไทย
- Tiếng Việt
- हिंदी
With BTC Tokens On The Move, Bitcoin Prepares For High Volatility
Published 06/09/2020, 08:53 AM
With BTC Tokens On The Move, Bitcoin Prepares For High Volatility
Latest comments
Loading next article…
Install Our App
Risk Disclosure: Trading in financial instruments and/or cryptocurrencies involves high risks including the risk of losing some, or all, of your investment amount, and may not be suitable for all investors. Prices of cryptocurrencies are extremely volatile and may be affected by external factors such as financial, regulatory or political events. Trading on margin increases the financial risks.
Before deciding to trade in financial instrument or cryptocurrencies you should be fully informed of the risks and costs associated with trading the financial markets, carefully consider your investment objectives, level of experience, and risk appetite, and seek professional advice where needed.
Fusion Media would like to remind you that the data contained in this website is not necessarily real-time nor accurate. The data and prices on the website are not necessarily provided by any market or exchange, but may be provided by market makers, and so prices may not be accurate and may differ from the actual price at any given market, meaning prices are indicative and not appropriate for trading purposes. Fusion Media and any provider of the data contained in this website will not accept liability for any loss or damage as a result of your trading, or your reliance on the information contained within this website.
It is prohibited to use, store, reproduce, display, modify, transmit or distribute the data contained in this website without the explicit prior written permission of Fusion Media and/or the data provider. All intellectual property rights are reserved by the providers and/or the exchange providing the data contained in this website.
Fusion Media may be compensated by the advertisers that appear on the website, based on your interaction with the advertisements or advertisers.
© 2007-2025 - Fusion Media Limited. All Rights Reserved.
