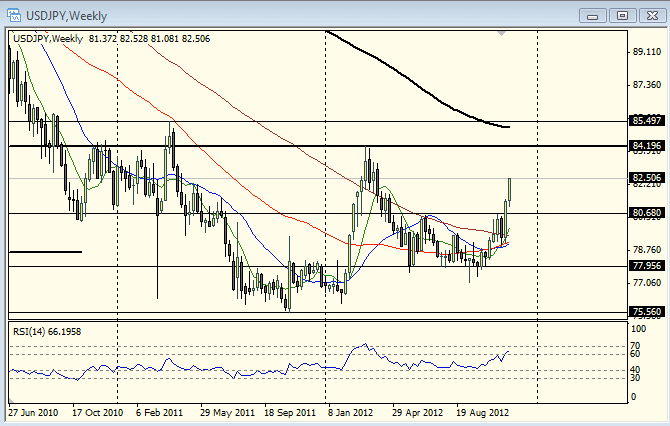
 USD/JPY Weekly Chart 11/21/2012" width="670" height="426">
Bottoms:
If you have been following the USD/JPY, you have seen a sharpy uptrend develop since September this year. The weekly chart shows that this rally bounced off a bottom developed in 2011. In a way, 2012 also created a bottom, and the past few weeks have seen the USD/JPY rise from this bottom as well.
Momentum: The RSI in the weekly chart pushed back above 60. When the RSI hits 70 holds above 40 and pushes back above 60 like it did, it is a reflection of bullish continuation momentum.
Targets: Before getting too ahead of ourselves. We have a couple of key resistance levels: the 2012-high at 84.19 and then the 2011 high at 85.50. While the Weekly RSI is just pushing above 60, the RSI readings in the daily down to the 1-hour charts hare above 70, showing overbought condition in the short-term. Perhaps a correction is due, but price action and momentum suggests more upside risk after.
Fan Yang CMT is the Chief Technical Strategist, trader, educator and a of the main contributors to FXTimes – provider of Forex News, Analysis, Education, Videos, Charts and other trading resources.
Information and opinions contained in this report are for educational purposes only and do not constitute an investment advice. While the information contained herein was obtained from sources believed to be reliable, author does not guarantee its accuracy or completeness. FXTimes will not accept liability for any loss of profit or damage which may arise directly, indirectly or consequently from use of or reliance on the trading set-ups or any accompanying chart analysis.
Original Post
