
Winnebago Industries Inc. (NYSE:WGO) reported adjusted earnings of 60 cents per share in the second quarter of fiscal 2019 (ended Feb 23, 2019), beating the Zacks Consensus Estimate of 56 cents. In the year-ago period, earnings were 69 cents a share. Net income decreased 2.2% year over year to $21.6 million.
Revenues in the reported quarter declined 7.6% to $432.7 million from $468.4 million in the prior-year quarter. However, the figure outpaced the Zacks Consensus Estimate of $426 million.
Operating income in the quarter under review decreased 18% to $28.9 million from $35.3 million in the year-ago quarter. Gross profit declined to $66.4 million from $67.7 million a year ago.
Winnebago Industries, Inc. Price, Consensus and EPS Surprise
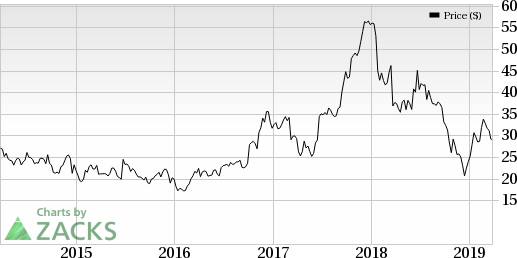
Winnebago Industries, Inc. Price, Consensus and EPS Surprise | Winnebago Industries, Inc. Quote
Segment Results
Revenues at the Motorhome segment were down 17.3% from a year ago to $164.7 million. Adjusted EBITDA declined 23.4% to $4.4 million.
Revenues at the Towable segment fell 5.9% to $250.7 million year over year. Adjusted EBITDA was $33.6 million, down 7.3% from the prior-year quarter.
Financial Position
Winnebago had cash and cash equivalents of $3.02 million as of Feb 23, 2019, compared with $2.34 million as of Aug 25, 2018.
For the first six months of fiscal 2019, Winnebago’s cash flow from operations was $51.9 million compared with $36.9 million in the same period of fiscal 2018.
In a year’s time, shares of Winnebago have outperformed the industry it belongs to. Its stock fell 21.1% in comparison with the industry’s decline of 53.3%.
Zacks Rank and Stocks to Consider
Winnebago currently carries a Zacks Rank #3 (Hold).
A few better-ranked stocks in the auto space are Ferrari N.V. (NYSE:RACE) , Oshkosh Corporation (NYSE:OSK) and Dana Incorporated (NYSE:DAN) . While Ferrari currently sports a Zacks Rank #1 (Strong Buy), Oshkosh and Dana carry a Zacks Rank #2 (Buy). You can see the complete list of today’s Zacks #1 Rank stocks here.
Ferrari has an expected long-term growth rate of 18.5%. Over the past year, shares of the company have risen 9.5%.
Oshkosh has an expected long-term growth rate of 11.3%. Over the past three months, shares of the company have gained 21.4%.
Dana has an expected long-term growth rate of 4.4%. Over the past three months, shares of the company have risen 24.3%.
Is Your Investment Advisor Fumbling Your Financial Future?
See how you can more effectively safeguard your retirement with a new Special Report, “4 Warning Signs Your Investment Advisor Might Be Sabotaging Your Financial Future.”
Click to get it free >>
Oshkosh Corporation (OSK): Free Stock Analysis Report
Dana Incorporated (DAN): Free Stock Analysis Report
Ferrari N.V. (RACE): Free Stock Analysis Report
Winnebago Industries, Inc. (WGO): Free Stock Analysis Report
Original post
Zacks Investment Research