Americans who believe technology will be the cure for all our problems, don’t count on wind and solar energy to save the day. This is the delusion I see over and over again in the Mainstream and alternative media. I even receive emails from followers who tell me not to worry, because the cost of producing solar will continue to fall. Soon I gather, we will be on our way to driving or flying millions of electric cars, just like in the old cartoon, the Jetsons.
It would be nifty to be able to fly millions and millions of vehicles in the sky. No doubt, we don’t kill enough insects or animals like rabbits and deer on America’s interstates and highways, so why should the birds be left out of all the fun?? We shouldn’t allow the lousy plant and animal kingdom to get in the way of human ingenuity and progress…. who needs em.
Yes, I am being sarcastic, but progress and technology hasn’t stopped us from pushing to extinction between 150-200 species of plant, insect, bird and mammal every day. That’s correct… every 24 hours. As they say…. less of them, means MORE FOR US. However, we may have to start to worry a bit once we wipe out most of the pollinating insects, especially the bees. If the bees go, then so does our food supply.
GOD HATH A SENSE OF HUMOR…..
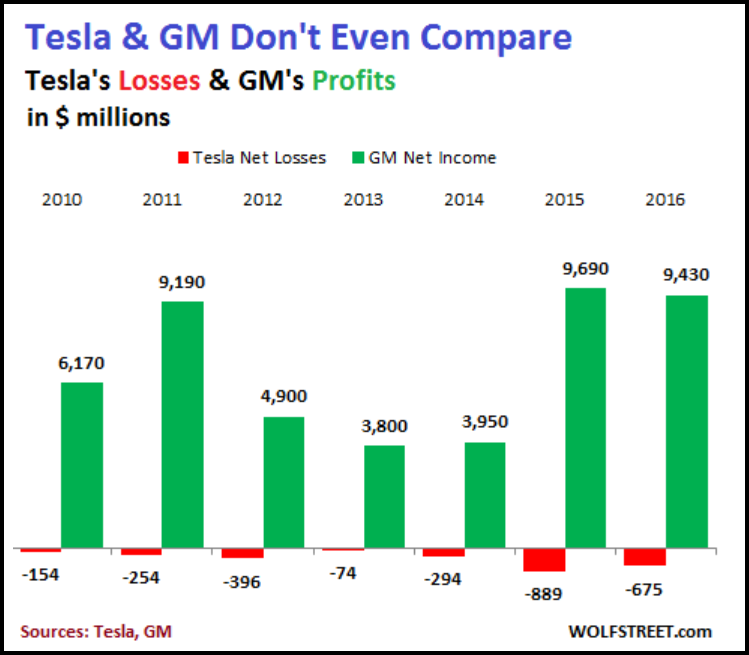
But, we shan’t worry about that if our focus in life is to upgrade to the next I-phone or switch the U.S. Interstate Highway from running on oil to stylish electric cars manufactured by Tesla. For those who are enamored by the wonderful “High-tech” stuff going on at Tesla Motors (NASDAQ:TSLA), please read the following article by Wolfstreet, What Tesla’s “Inexplicable” “Ponzi Scheme” Valuation Says about the Stock Market:

However, unlike GM, Tesla hasn’t gone bankrupt despite its massive losses and negative cash flows. Why? Because Tesla is able to extract new money from investors and lenders. So it won’t run out of money. As it burns that cash, it gets more cash so that it won’t have to go bankrupt. Companies only go bankrupt when investors and lenders, trying to cut their losses, say, “no more.” Then the money-losing companies cannot fund their operations any longer and instead hire bankruptcy lawyers.
…. In comparison with GM, Tesla is ludicrously overvalued. But it’s not “inexplicable.” It’s perfectly explicable by the wondrously Fed-engineered stock market that has long ago abandoned any pretext of valuing companies on a rational basis. And it’s explicable by the hype – the “research” – issued by Wall Street investment banks that hope to get fat fees from Tesla’s next offerings of shares or convertible debt.
Hopefully with a little more work on that technology, Tesla Motors will finally become profitable some time in the future. However, I wouldn’t hold my breath on that one. This stock is a perfect indicator of what is fundamentally wrong with the broader markets. And that is…… they are totally INSANE.
Americans… Don’t Count On Wind & Solar To Save The Day
When I get into a somewhat of a “Deep” conversation about our energy problems with friends, family or people in general, the typical response is… “TECHNOLOGY WILL SAVE THE DAY.” Now, I don’t know if they truly believe that, or they just say it because the reality is just too damn depressing. Either why, the data provides clear proof that WIND & SOLAR will not be the “Energy Silver Bullet” to solve all our problems.
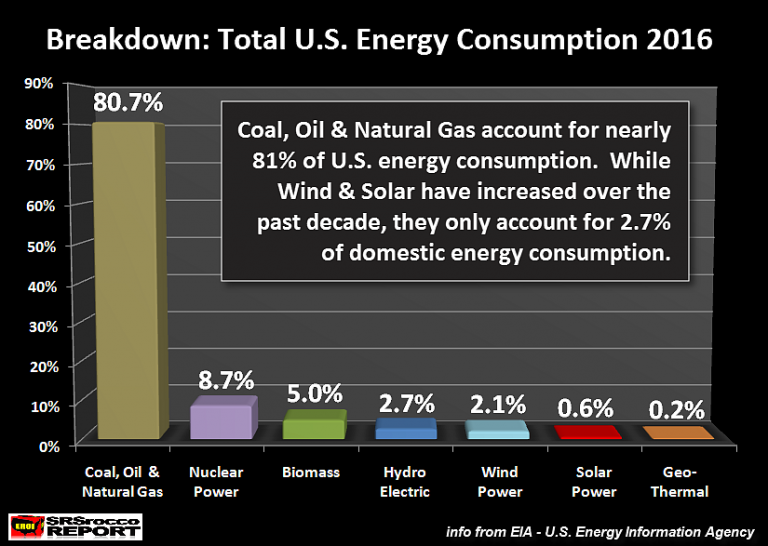
If we look at a chart below showing the breakdown in the amount of energy consumption (in quadrillion BTU’s) in the United States, wind and solar are those tiny light blue and red smudges on the right hand side:

The only energy source that comes in last behind Wind and Solar, is Geo-thermal. Currently, Solar Power accounts for 0.6% of our total energy consumption, while Wind Power provides 2.1%. If we add, Wind, Solar and Geo-thermal, they still account for less than 3% of the United States energy consumption.
While it is true that U.S. Solar Power consumption has increased nearly 10 times since 2000, it is still peanuts. Let me put it another way. If we look at U.S. energy consumption using a Dollar metric, Solar Power is producing 60 cents worth of energy, versus $80.70 for Coal, Oil and Natural Gas. So, it may be impressive to see Solar Power increase from less than 6 cents of the $100 bill in 2000 to 60 cents currently, but it’s still a fraction of our total energy consumption.
Regardless, individuals who finally realize just how little energy Solar Power is generated by in the U.S., still pin their HOPES that the “Wonderful Solar Industry” is going to pull a rabbit out of a hat so we can continue going to McFats, Starbucks (NASDAQ:SBUX) and Walmart (NYSE:WMT). Unfortunately, the Solar Industry has taken a turn for the worse as the oil price collapsed.
According to the article, Suddenly The Solar Boom Is Starting To Look Like A Bubble:
By all accounts, 2016 should be a great year for solar power providers. In December, Congress extended the federal investment tax credit for solar installations through 2022, convincing analysts to project strong growth for the solar industry in coming years. Prices for solar panels continue to decline, even as emissions reduction targets reached under the Paris climate accord drive governments to seek more power from renewable energy sources. Several recent reports have shown that the cost of solar is often comparable or nearly comparable to the average price of power on the utility grid, a threshold known as grid parity.
But investors are not feeling the love. This week shares of U.S. solar leader SolarCity tumbled to a new low, while several other solar companies also took a pounding. Last month Nevada introduced sharp cutbacks in its program for net metering—the fees paid to homeowners with rooftop solar installations for excess power they send back to the grid. California and Hawaii, two of the biggest solar markets, have introduced changes to their net metering schemes as well. Across the country, as many as 20 other states are considering such changes, which would dramatically alter the economics of rooftop solar.
Sunedison Inc (OTC:SUNEQ): Declares Bankruptcy As The Once Mighty Solar Energy Company Stock Falls Of Cliff
Unfortunately, a lot of Solar Stocks are looking quite horrible. However, SunEdison takes the case. SunEdison, with 7,000 employees in 2014, started to experience serious trouble when it suffered a string of annual losses. SunEdison lost $1.5 billion in 2011, $151 million in 2012, $587 million in 2013, $1.2 billion in 2014 and another $919 million in the first three quarters of 2015.
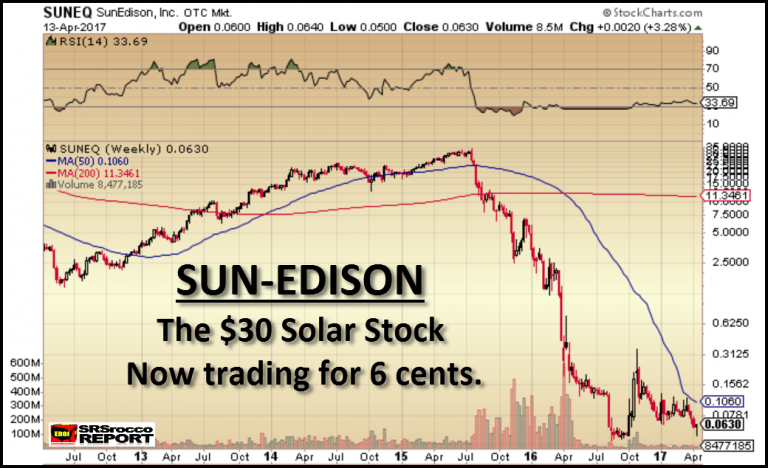
It didn’t take much more before investors started to realize they were SOLAR BAG HOLDERS. In 2016, SunEdison filed for bankruptcy protection as its stock price did a stunning NOISE-DIVE. At its peak, SunEdison’s stock was trading for $30 a share. Today, its trading at a whopping 6 cents a share:

Now, if you look at the SunEdison stock as see how it continued higher and higher even though it suffered more and more annual losses, investors had no idea they were holding onto a PIECE OF GARBAGE until the bottom fell out and the stock price plummeted.
For those investors who are CONNECTING the DOTS between SunEdison and Tesla, I would imagine you are not suffering from BRAIN DAMAGE as are most of Americans who still have their funds in most STOCKS, BONDS and REAL ESTATE.
As my favorite comedian, George Carlin said, “Folks there’s a lot of BS out there… and it ain’t good for you.”
The U.S. Empire Is In Serous Trouble As Its Energy EROI Continues To Fall
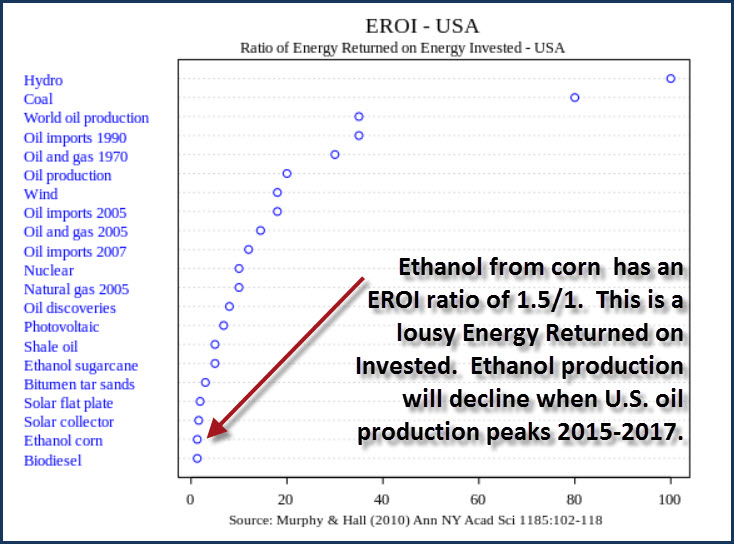
The U.S. Empire is in big trouble because the “Quality” of the energy it uses, to continue running business as usual, is declining significantly. As provided in the chart above, the U.S. consumes nearly 81% of its energy from coal, oil and natural gas. The EROI – Energy Returned On Investment of these three energy sources continues to decline.

Please take some time looking over those Energy EROI figures. While it is true that this chart was developed in 2010, and solar has become cheaper and efficient, the EROI trend for U.S. energy is heading lower. As we can see, ethanol and biodiesel with a ultra-low EROI of 1.5/1, isn’t really worth producing.
The United States needs a much higher energy EROI of closer to 20/1 to run everything. While that figure is more an estimate, it is a good guideline as the U.S. started to run into a lot of trouble when it fall below 30/1 in 1970.
I will be writing more articles on the EROI and how it will impact the United States and the rest of the world going forward. I also plan on writing an article on the RISE & FALL OF THE SOLAR INDUSTRY.
Now, don’t get me wrong, I am not against renewable energy. However, solar and wind are really not renewable… they are Coal, Oil and Natural Gas derivatives. Without those three energy sources, we wouldn’t be able to manufacture many solar panels or wind turbines.
