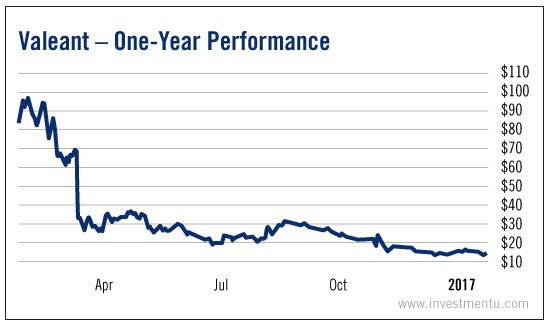
In some cases, a stock crashes due to circumstances beyond its control. Valeant Pharmaceuticals (NYSE:VRX) is not one of those cases. Valeant stock is edging toward zero and most of the investing public understands why.
In 2016, a scandal came out of Valeant that rocked the pharmaceutical world. The conglomerate had participated in a series of extremely unethical price-rigging schemes for important drugs. It also apparently maintained “pay-to-play” relationships with several specialty pharmacies -- another giant ethical no-no.
As a result, Valeant stock is down almost 85% in the last year.

On the other hand, when companies are in this bad shape, one of two things can happen: They can go under... or they can eventually recover, creating the ultimate contrarian buy opportunity.
We saw the latter scenario play out with Deutsche Bank (NYSE:DB) (NYSE: DB) in the last year. Most analysts left the stock for dead after its Brexit troubles in mid-2016. But it survived and recovered, handing incredible gains to investors who bought the bottom.
Thus, in this crisis period for Valeant stock, Investment U readers are wondering... what are its prospects for recovery? Is the scandalized pharmaceutical company a good contrarian buy?
To find out, we ran Valeant stock through the Investment U Fundamental Factor Test. (As a reminder, our checklist looks at six key metrics to diagnose the financial health of a stock.)
- Earnings-per-Share (EPS) Growth: Valeant stock is off to a spectacularly bad start in our analysis. The pharmaceutical industry generally manages healthy earnings growth - averaging 46.79% in the last year. Valeant’s earnings growth rate over the same period is -524%. It’s gone below zero.
- Price-to-Earnings (P/E): And since Valeant stock’s earnings are now in the negatives, we can’t calculate a P/E ratio. Strike two.
- Debt-to-Equity: Once again, Valeant does nonsensically bad on this metric. Its debt-to-equity ratio is a whopping 712.40%. Its competitors have a reasonable average debt burden of 49.97%.
- Free cash flow per share growth (FCF) As a whole, pharmaceutical companies are quite cash rich right now. The average firm in the space has grown free cash flow per share by 89.90% in the last year. Valeant has seen it sink -28.06%.
- Profit Margins: In case it wasn’t clear already, Valeant is bleeding money right now. Its profit margin of -49.14% is well below the industry average of 19.56%.
- Return on Equity: In our last metric... Valeant is still failing. Early-stage investors have lost -42.45% on their Valeant equity in the last year. By contrast, the pharma industry has been kind to most investors, handing them an average gain of 17.90%.
As you can see, Valeant stock got shut out on all six key metrics. Earnings, valuation, debt, cash flow, profits, returns - no matter what you look at, Valeant is below average.
At least from a fundamental analysis perspective, it seems safe to say that Valeant stock is irredeemable.
Granted, we can’t guarantee that it won’t recover. Crazier things have happened. But not even Deutsche Bank was this far gone. The prospects for Valeant getting out of this are pretty limited.
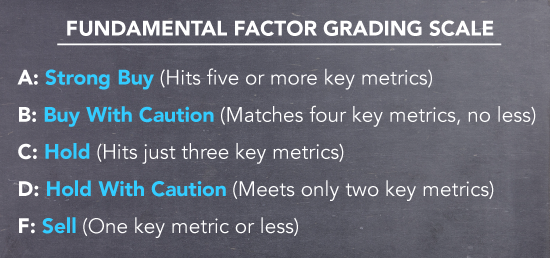
For these reasons, Valeant stock has earned a grade of F. Get rid of it if you haven’t already.
Fundamental Factor Test Score
F: Sell (One key metric or less)

