There’s no shortage of indicators to monitor for deciding if the expected runup in inflation is a temporary affair or regime shift that signals a longer-term rise in pricing pressure. I recently considered several of the usual suspects, including core inflation and the Treasury market’s implied forecasts, for tracking this risk. But this only scratches the surface of possibilities. Considering options for what might be labeled alternative metrics, the Treasury term premium deserves to be on the short list.
The term premium (TP) is one of the three main components for decomposing Treasury yields. The other two – expectations about inflation and the path of short-term rates – tend to draw the most attention. Perhaps that’s because of the three, estimating TP is more challenging. Regardless, it’s worthy of routine attention in the art/science of deciding if inflation risk is rising, falling or holding steady.
TP, unfortunately, can’t be observed directly and so a model is required. There are many to choose from and if you line up the results you’ll get a variety of results. The good news is that most estimates tend to align in terms of overall trend direction.
Regardless of the model, the basic premise for the many flavors of TP is the same. In essence, TP is an ex ante estimate of what you’ll earn (or not) for holding longer-term bonds vs. continually rolling over shorter-term securities for the same period as the longer-term maturity. For example: How will your returns differ for holding a 10-year bonds till maturity vs. holding a 1-year security and rolling it over every year for a decade? This risk is distinct from, say, a standard yield curve analysis, which compares the return from yields over different holding periods.
Former Federal Reserve Chairman Ben Bernanke advises that there are two key factors driving term premiums: “(1) changes in the perceived riskiness of longer-term securities and (2) changes in the demand for specific securities (or classes of securities) relative to their supply.”
All else equal, term premiums on longer-term securities will be higher when investors are more risk-averse and/or the perceived risk of holding those securities is high. Historically, the most important risk for long-term bondholders has been the risk of unexpected inflation.
If investors begin to perceive that inflation risk is rising, the market will demand additional compensation for this risk, which will show up in higher term premiums. On that front, we can monitor this risk by keeping an eye on TP trends.
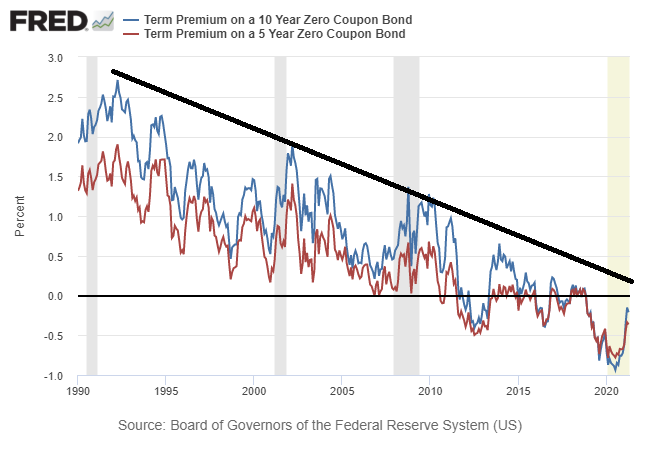
Consider, for example, how the three-factor Kim-Wright model stacks up in recent years. As the chart below shows, TP has been in a long-term decline for the 5- and 10-year maturities. There’s been sharp bounce in recent months, but to date this appears to be a recovery from the pandemic-related drop in 2020.

The question is whether the recent rise breaks the trend? To date, no – the latest recovery is still in line with the downside volatility channel that’s prevailed for the past 30 years. The disinflation trend, in short, remains in force until a significant reversal suggests otherwise.
What defines “significant”? Minds will differ, but if TP estimates in the chart above rise to roughly +0.5% (and continue to rise), that would be a sign that it may be different this time. By that standard, there’s still a wide gap to recover before declaring that the TP’s long-running disinflationary trend is dead. Indeed, current TP estimates remain moderately negative. The 10-year estimate, for instance, was roughly -0.2% at the end of April.
TP looks set to rise in the months ahead, in part thanks to recovery expectations for inflation. Next week’s April report on consumer prices, for instance, is projected to reflect hotter pricing pressure.
The mystery is whether the stronger inflation that’s coming is temporary. At the moment, debate rages. The answer, unfortunately, won’t be known until the second half of this year at the earliest, when the deflationary shock of last year begins to fade from the year-over-year comparisons.
