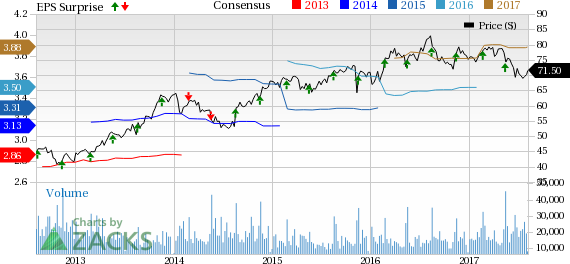
The TJX Companies, Inc. (NYSE:TJX) is slated to report second-quarter fiscal 2018 results on Aug 15, before the opening bell. This leading off-price retailer’s earnings have outpaced the Zacks Consensus Estimate for ten straight quarters, with a trailing four-quarter average beat of 4.1%.
With this in mind, let’s now look into some factors that are likely to impact second-quarter results.
Which Way are Estimates Treading?
A look into estimate revisions give us an idea of what analysts are thinking about the company right before earnings release. The Zacks Consensus Estimate for the second quarter as well as for 2018 has been stable over the past 30 days at 84 cents and $3.88, respectively. Further, estimated earnings for fiscal 2018 depict a year-on-year growth of 9.9%. The same for the second quarter depict a growth of 2.4% from the prior-year period.
Analysts polled by Zacks expect revenues of $8.32 billion for the said quarter, depicting a 5.6% growth from the prior-year period. Also, revenues for fiscal 2018 are expected to increase 7.3% to $35.59 billion.
What Does the Zacks Model Unveil?
Our proven model does not show that TJX Companies is likely to beat estimates this quarter. This is because a stock needs to have a Zacks Rank #1 (Strong Buy), 2 (Buy) or 3 (Hold) as well as a positive Earnings ESP for this to happen. You may uncover the best stocks to buy or sell before they’re reported with our Earnings ESP Filter.
TJX Companies has an Earnings ESP of 0.00% as both the Most Accurate estimate and the Zacks Consensus Estimate are pegged at 84 cents. The company carries a Zacks Rank #2, which increases the predictive power of ESP. However, its ESP of 0.00% makes surprise prediction difficult.
TJX Companies, Inc. (The) Price, Consensus and EPS Surprise
Factors Influencing the Quarter
TJX Companies expects pre-tax margins to remain under pressure for the next few quarters due to an increase in employee payroll. The company announced a wage hike of all full- and part-time hourly U.S. store associates during the fourth-quarter fiscal 2016 conference call, which is expected to negatively impact fiscal 2018 earnings. Further, the company expects incremental investments, additional supply chain costs and pension costs to dent margins in the coming quarters.
Margins of the company are also seen to be facing the crunches of rising product costs. TJX Companies, being an off-price retailer, cannot increase the price of its products, which leads to lower margins. Moreover, lack of exposure in the emerging markets as well as currency related headwinds continue to pose as challenges for the company.
Such aspects have been bearing brunt on the company’s share price performance. Over the past six months, shares of TJX Companies have declined 7.2%, comparing unfavorably with the Retail-Wholesale sector’s growth of 12.9%.

Nevertheless, we are optimistic about TJX Companies’ business expansion initiatives, which include aggressive store opening strategies. The company has been opening stores regularly and expanding rapidly across the U.S., Europe and Canada. Dedicated marketing and advertising campaigns through multiple mediums have been boosting traffic at its stores. Notably, TJX Companies has delivered positive comparable store sales growth in the past 32 quarters. The company has been undertaking numerous initiatives to boost online sales. We expect that the company’s strategic efforts would aid lifting up its performance in the forthcoming periods.
Do Retail Stocks Catch your Attention? Check These
Investors may also consider other stocks from the same segment such as Build-A-Bear Workshop, Inc. (NYSE:BBW) , Big Lots, Inc. (NYSE:BIG) and Burlington Stores, Inc. (NYSE:BURL) , all carrying a Zacks Rank #2.You can see the complete list of today’s Zacks #1 Rank stocks here.
Build-A-Bear Workshop has an average positive earnings surprise of 73.7% over the past four quarters. It has a long-term earnings growth rate of 22.5%.
Big Lots has an average positive earnings surprise of 83.1% over the past four quarters. It has a long-term earnings growth rate of 13.5%.
Burlington Stores has an average positive earnings surprise of 22.6% over the past four quarters. It has a long-term earnings growth rate of 15.9%.
More Stock News: Tech Opportunity Worth $386 Billion in 2017
From driverless cars to artificial intelligence, we've seen an unsurpassed growth of high-tech products in recent months. Yesterday's science-fiction is becoming today's reality. Despite all the innovation, there is a single component no tech company can survive without. Demand for this critical device will reach $387 billion this year alone, and it's likely to grow even faster in the future.
Zacks has released a brand-new Special Report to help you take advantage of this exciting investment opportunity. Most importantly, it reveals 4 stocks with massive profit potential. See these stocks now>>
Big Lots, Inc. (BIG): Free Stock Analysis Report
TJX Companies, Inc. (The) (TJX): Free Stock Analysis Report
Burlington Stores, Inc. (BURL): Free Stock Analysis Report
Build-A-Bear Workshop, Inc. (BBW): Free Stock Analysis Report
Original post
Zacks Investment Research

