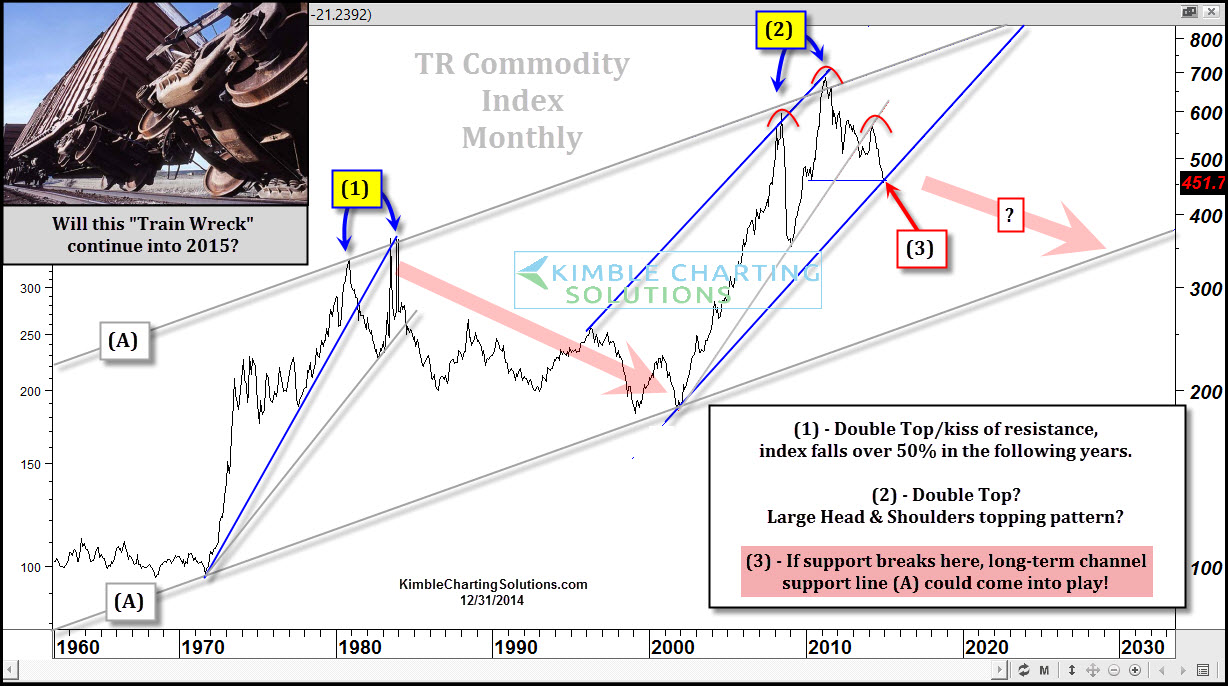
When it comes to "financial train wrecks" in 2014, the TR Commodity Index has had one. The index has lost 20% of its value since the first of May. I shared with members in May that billions of free thinking people around the world may have created one of the largest Head & Shoulders topping patterns I have seen in my 34 years in the business.
Is this a monster topping pattern? Even if I am wrong on the H&S pattern, the index kissed the underside of resistance in May and has fallen hard, now placing it at one of its most important tests of support in the past 15-years.
Looking back at (1), the index appears to have made a Double top, then it proceeded to fall for the next 20-years and losing 50% of its value in the process. The index may have created another double top at (2) at the top of channel (A).
The key to this index's pattern right now is what happens at (3). A support test of a 15-year rising channel is in play at this time! Should support fail to hold here, the index could find its way to the bottom of rising channel (A), which is about 30% below current prices.
When the double top at (1) took place in the early 1980's and support broke, the index fell for the following 20 years (1982-2002). How did stocks react during this 20-year commodity bear market? Looking back they blasted off for the next 20 years, as valuations were dirt cheap in 1982.
If this key commodity index breaks support at (3), will stocks blast off again or will it be different this time, since valuations are a little different? Valuations are "only 90% above 100 year averages!" (see post here)
One asset class that might like a breakdown of commodities at (3), could be bonds. Theeuro is near 6-year channel support, if this gives way, odds increase commodities remain in a down trend.
How do you think stocks will react if this commodity index would fall to the bottom of channel (A), which is about 30% below current prices???

