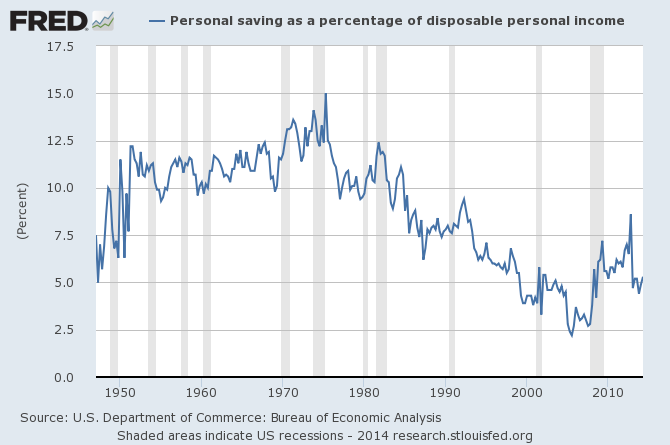
The common perception is that the personal savings rate is half of the savings rate in the 1950's, 1960's, and the 1970's. This perception is both true and misleading.
Follow up:
Personal saving, as defined by the Bureau of Economic Analysis (BEA), is the difference between disposable income and consumption (expenditures on goods and services.) Translation: This is unspent disposable income. From an economists point of view, this is the amount of slack in personal spending - but it is NOT a calculation of rainy day funds (including buildup of reserves for retirement). To the average consumer, "savings" is what you add to a retirement account, bank account, or invest in some manner.
Now consider one of the definitions of savings:
... the money one has saved, especially through a bank or official scheme. Synonyms: nest egg, money for a rainy day, life savings; capital, assets, funds, resources, reserves
The BEA produced personal savings amount is not trying to calculate one's nest egg, money for a rainy day, life savings, capital, assets, funds, resources, or reserves. Consider the purpose of rainy day funds:
- saving for education for your family
- cash buffer in case you lose your job
- cash buffer for sickness / disability
- money put away for retirement
Social safety nets have vastly expanded and improved over time - and the need for rainy day funds has been mitigated by government programs to pay ever increasing amounts for unemployment, disability, and social security benefits. Further, the consumer is paying higher taxes to be able to benefit from these safety nets. This means that disposable income was reduced by these taxes - but at the same time the need to save to pay for these rainy day events is also reduced. Consider further that savings accounts for education are no longer necessary as the government is handing out student loans as if it were candy (regardless of the economic consequences).
Consider retirement as an example. The tax rate for social security (including employer payments) has gone from 1% in 1937 to 4.5% by 1960, 6.9% in 1970, 8.1% in 1980, and 15.3% since 1990 (which by then included Medicare). Not to say that social security is adequate to support one's lifestyle in retirement - but with proper planning (like home ownership and other investments) it takes a significant load off of retirement's rainy day needs. Medicare takes the health care load off of the retired consumer. So a consumer does not need to "save" as much going into retirement to survive.
Social security is a RETIREMENT mechanism which essentially acts the same way as a pension one pays into. Both should be considered savings for a rainy day. If one considers social safety nets as a rainy day savings - then suddenly person savings jump from 5% to over 30% of disposable income (blue line in graph below). One can add over 1% to the savings rate if we add pensions (red line).
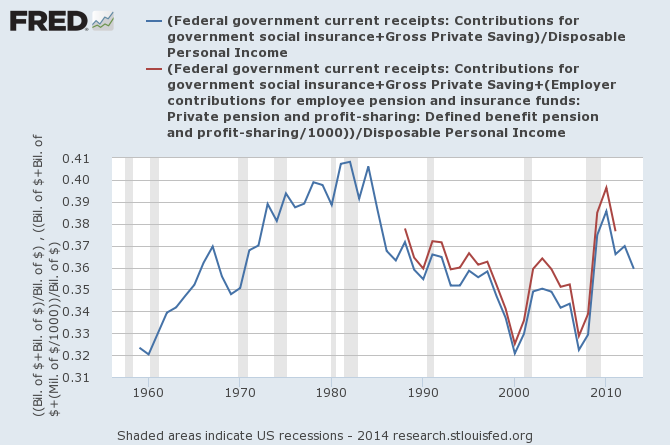
And the above chart does not include investment appreciation. For those who think the percentages seem a little high, remember that taxes (such as social security) is based on gross employment earnings. In other words, disposable personal income currently is 88% of personal income. Further, the percentages in the above graph include employer taxes paid with and without matching employee contributions.
The perception of the current lower BEA savings rate is that the consumer is just not saving compared to past periods. Because of the improvement in the social safety nets, consumers do not need to "save" as much for a rainy day. Further if we examine "taxes" we pay for the social safety nets - and consider them savings - then the USA consumers are saving at a high rate. This rate would be higher if one included 401(k)s, equity flows, IRAs, and purchasing houses - all savings for rainy day.
One caveat is that the above information is for the average consumer - not the median. I suspect, however, that because of the government's social safety nets - that the median and average "savings" percentages are not very much different - and it is even possible that the median is higher than the average (because the rich pay a smaller percent of their income to social safety net taxes).
Other Economic News this Week:
The Econintersect Economic Index for August 2014 is showing our index at a 3 year high. Outside of our economic forecast - we are worried about the consumers' ability to expand consumption although data is now showing consumer income and expenditures growth are similar. The GDP expansion of 4% in 2Q2014 is overstated as 2.1% of the growth would be making up for the contraction in 1Q2014, and 1.7% of the growth is due to an inventory build.
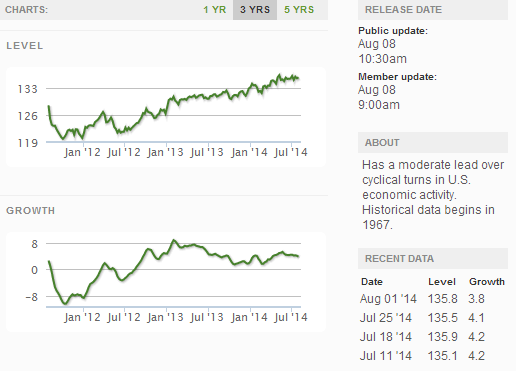
The ECRI WLI growth index value has been weakly in positive territory for many months - but now in a noticeable improvement trend. The index is indicating the economy six month from today will be slightly better than it is today.
Current ECRI WLI Growth Index
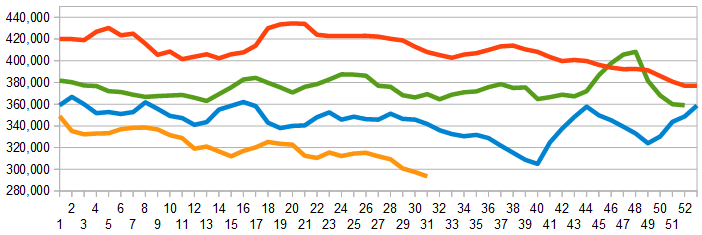
The market was expecting the weekly initial unemployment claims at 295,000 to 315,000 (consensus 305,000) vs the 289,000 reported. The more important (because of the volatility in the weekly reported claims and seasonality errors in adjusting the data) 4 week moving average moved from 297,500 (reported last week as 297,250) to 293,500.
Weekly Initial Unemployment Claims - 4 Week Average - Seasonally Adjusted - 2011 (red line), 2012 (green line), 2013 (blue line), 2014 (orange line)
Bankruptcies this Week: Privately-held Entegra Power Group, Eagle Bulk Shipping
Weekly Economic Release Scorecard:
Click here to view the scorecard table below with active hyperlinks
