by Clement Thibault
One of the more well-known market timing analogies goes something like this: you should never try to catch a falling knife. When it comes to the price of oil, however, perhaps there should be a different spin on the analogy. What if you already knew there's an historic pattern: the knife always falls, hits the ground, then jumps right back up—with the handle rather than the blade pointing towards you? What would you do then?
Oil's price is still a knife, of course, and still risky, but it's a long way from the accepted notion of a falling knife. At today's prices, oil appears to be that disciplined knife. Indeed, historically, when crude falls drastically, it always rises from the ashes. And for those brave enough to go long at the bottom, there’s a hefty profit to be made—eventually.
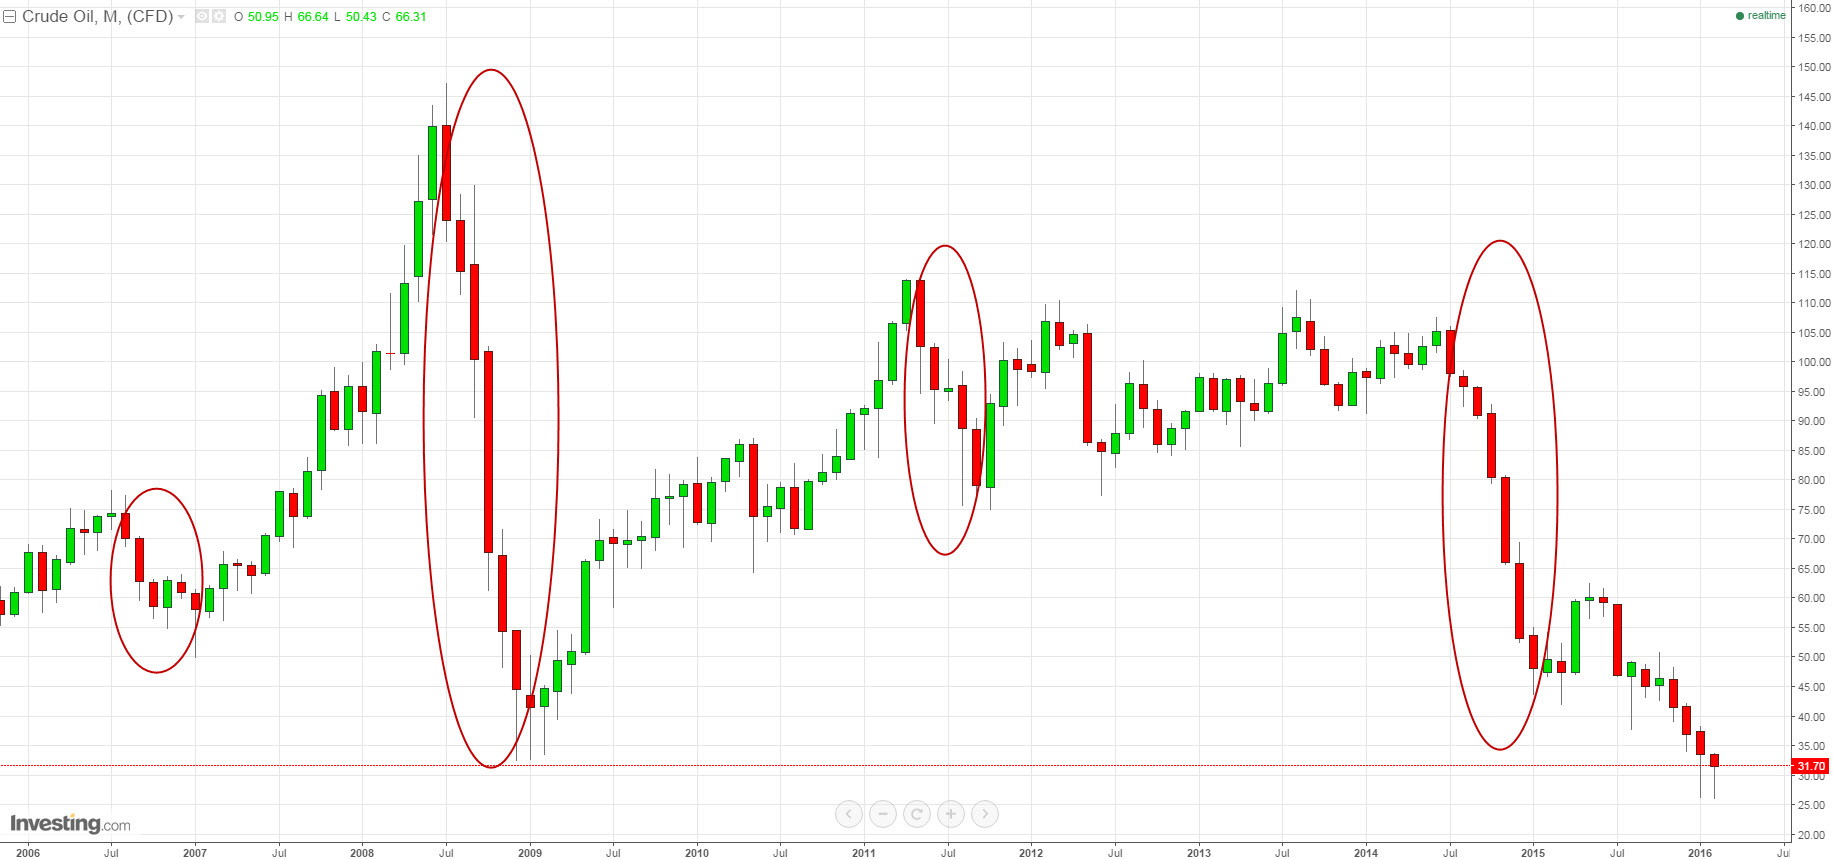
Looking at the past ten years, we've seen a few ups and downs in oil prices. While prices today are at their lowest level of the last decade, down 75% from the summer of 2014, this is not the biggest, uninterrupted price plunge over this timeframe.
Indeed, that ‘honor’ belongs to the six-month-long commodities slump that occurred between July 2008 and January 2009. At that time, oil prices fell by as much as 78%, from $147 to $32 a barrel.
Chronologically, the first serious price drop of the last decade occurred between July 2006 and January 2007. During the summer of 2006, prices were as high as $78 a barrel after, among other events, the Israel-Hezbollah conflict on Israel's northern border.
Prices then proceeded to fall, partly because in the autumn of 2006, hurricane season—usually a time when oil rigs are evacuated to ensure the safety of the workers, thus limiting supply and driving prices up—was relatively mild. Therefore, production continued uninterrupted, bringing down oil prices, which had already priced in hurricane season effects.
By January 2007 a barrel of oil was selling for just under $50, a significant drop of 36.35%. Some readers may remember what happened next: 6 months after this low, during July 2007, oil rebounded almost exactly back to its price from the year before—$78/bbl. This recovery, backed by strong Asian demand, benefited investors with returns of more than 56% over half a year.
Oil’s other price crash of the decade occurred during the second half of 2008. Strong Asian demand, as well as new money from investors discovering the commodities sector, catapulted oil into unknown territory, with the highest price recorded at over $147.
Shortly thereafter, the global economic crisis brought the financial world—and oil—to its knees, as oil prices cratered, reaching $32 a barrel during January 2009, for a negative return of -78%. Pessimists predicted the end of the world at the time, but savvy optimists were handsomely rewarded.
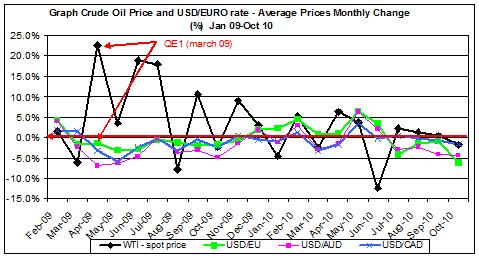
Oil prices climbed up to $73 in June 2009, or 126% more than it price just 6 months previous. Many in the market considered this odd (and hard to explain) rally a to be a direct result of the Fed’s QE1.

Chart: Trading NRG
The Arab Spring in 2010 and the Libyan crisis led to higher oil prices in 2011—topping at $114 during May. Subsequently, the Greek debt crisis weighed on both stocks and commodities, bringing prices down from their earlier highs.
In addition, a decrease in expected energy demand, as well as worries about a possible recession, brought prices down to $75 in September of that year, a 34% loss of value. And then the geopolitical landscape shifted once again.
Iran, angered by the sanctions against its nuclear ambitions, scared investors who thought the Persian regime might close the Strait of Hurmuz, which would have resulted in a global energy shortage. This fear drove an oil price spike, $110 a barrel in March 2012—or up more than 47% from the September lows.
More recently, a year-and-a-half ago to be exact, increased production by US shales coupled with a decrease in global demand fueled the major oversupply problem we are currently experiencing. Oil dropped from the July '14 high of $106 all the way down to $43 a barrel in January '15.
But oil being oil, market volatility proved beneficial to those ready to grab the knife. The Fed’s decision not to raise interest rates too quickly, along with a slowdown in production from US shale drillers and violence in Yemen, led oil prices higher yet again, to $62 in May 2015, a gain of 43% from the low-point of oversupply concerns.

Clearly there's a trend here. First, it should be acknowledged that sudden changes in geopolitical circumstance affect commodity prices, even though the commodity, in this case oil, has an obvious and proven tendency to rebound.
Ever since the 1980s, whenever Saudi Arabia flooded the oil market—much like they’re doing again today—at the same time, the desert kingdom has also lowered production while its fellow OPEC members also contributed some cuts, as a way of pushing prices up while demonstrating their control of the oil markets.
But the current landscape in the oil market has led the world’s biggest exporter to keep pumping activity at record-highs, in order to force out smaller market players such as US shale drillers and Canadian sand producers, and at the same time grab additional market share.
Iran’s intentions appear to be similar. After suffering through years of sanctions, Tehran is eager to raise output until their export levels are back at, or near, pre-sanction levels. That could mean as much as another 1 million barrels a day of Iranian crude flooding an already oversupplied market.
It seems like prices are in a race to the bottom in a way they may never have been before, a contest that the Saudis, the Americans and the Iranians each believe they can win. The question then is who will finally be the first to break under the pain of low prices?
For investors, the question might be even more significant. How much longer will it be till the trend reverses and the rebound finally begins?
