Investing.com’s stocks of the week

It has been 273 calendar days since the Dow Jones Industrial Average last closed above 18000 and 482 days since it first closed above 18000. The first time was December 23, 2014 and the last was July 20, 2015. For nearly one and a half years, the Dow has been struggling to move beyond 18000. Absent a major catalyst, DJIA’s struggles are likely to persist.
After The Cross
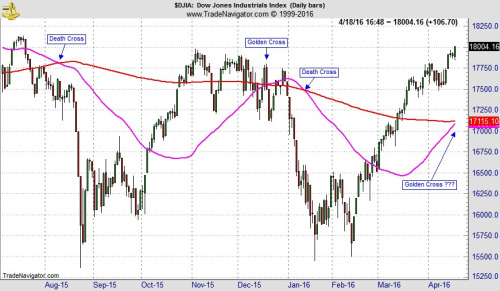
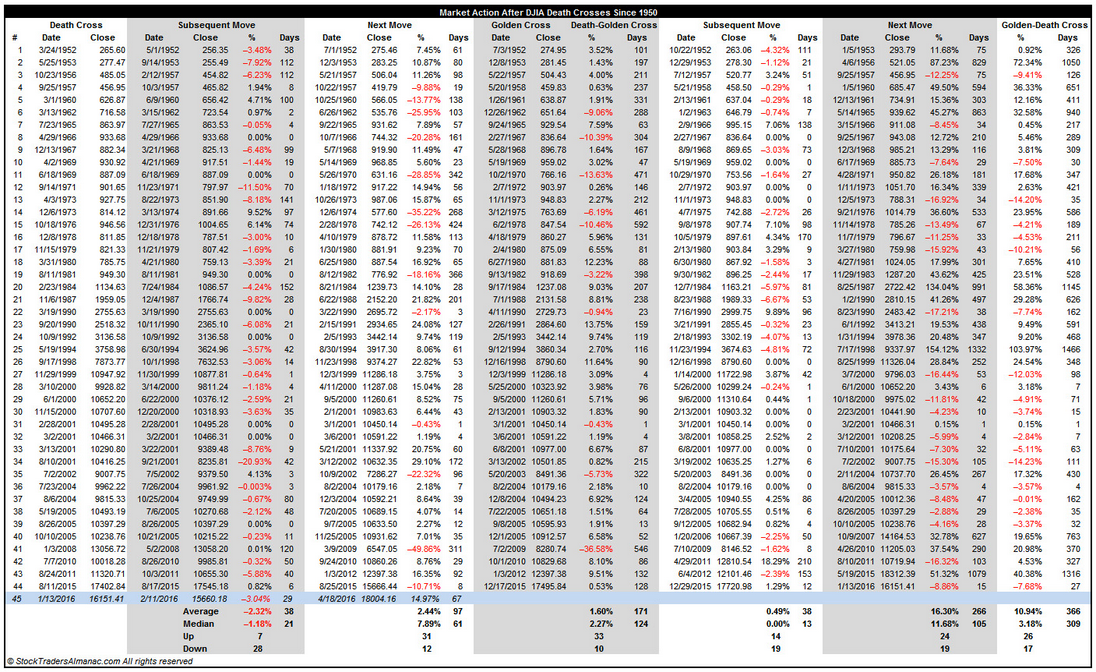
DJIA’s strength has caused its declining 200-day moving average to move sideways and its 50-day moving average to jump briskly higher. As of Monday’s close, they are separated by just 29.68 points. If the 50-day average crosses above the 200-day average it would trigger a golden cross. Generally, a golden cross is considered a bullish event however that was not the case last December 17. In fact since about 2000, the majority of golden crosses have occurred near a top with numerous flat or negative DJIA “Subsequent Moves” and “Next Moves.” Out of 36 such moves since 2000, only 5 have been double-digit or greater advances. The largest was a QE-fueled 51.32% move from June 4, 2012 through May 19, 2015 (DJIA’s All-time closing high date).

