US labor market strengthened again and the yield curve inversion looks to be over. Has the sky cleared? Hold on, Brexit is just around the corner. Given the circumstances, are gold prices more likely to rise or fall?
America Creates Almost 200,000 New Jobs In March
US economy added 196,000 jobs last month, following a disappointing rise of 33,000 in February (after an upward revision). The number surprised on a positive side, as the economists forecasted 177,000 created jobs.
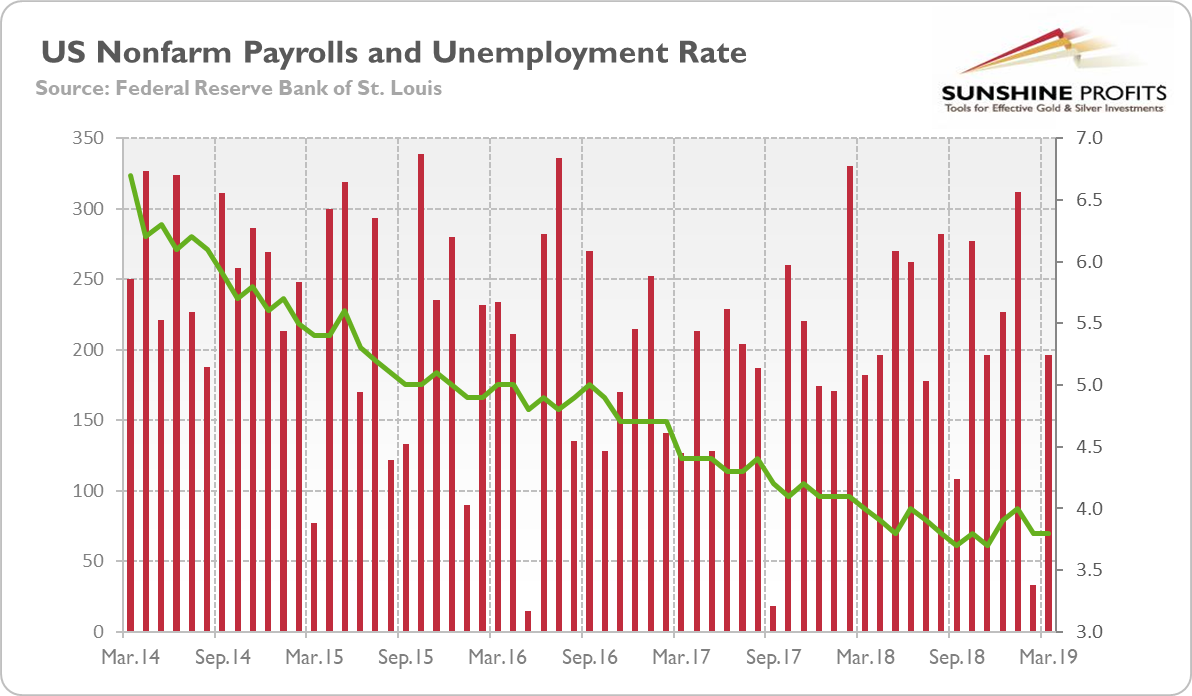
Moreover, the strong headline number was accompanied by positive revisions in February and January. With those, employment gains in these two months combined were 14,000 higher than previously reported. In consequence, after revisions, job gains have averaged 180,000 per month over the last three months, which is lower than several months ago, but still a healthy level, as the chart below shows.
Chart 1: Monthly changes in employment gains (red bars, left axis, in thousands of persons) and unemployment rate (green line, right axis, U-3, %) from March 2014 to March 2019.

The March Employment Situation report indicates, thus, that the current economic expansion still has plenty of room to run despite growing worries about the slowdown or even an upcoming recession. It is not a good news for the gold bulls.
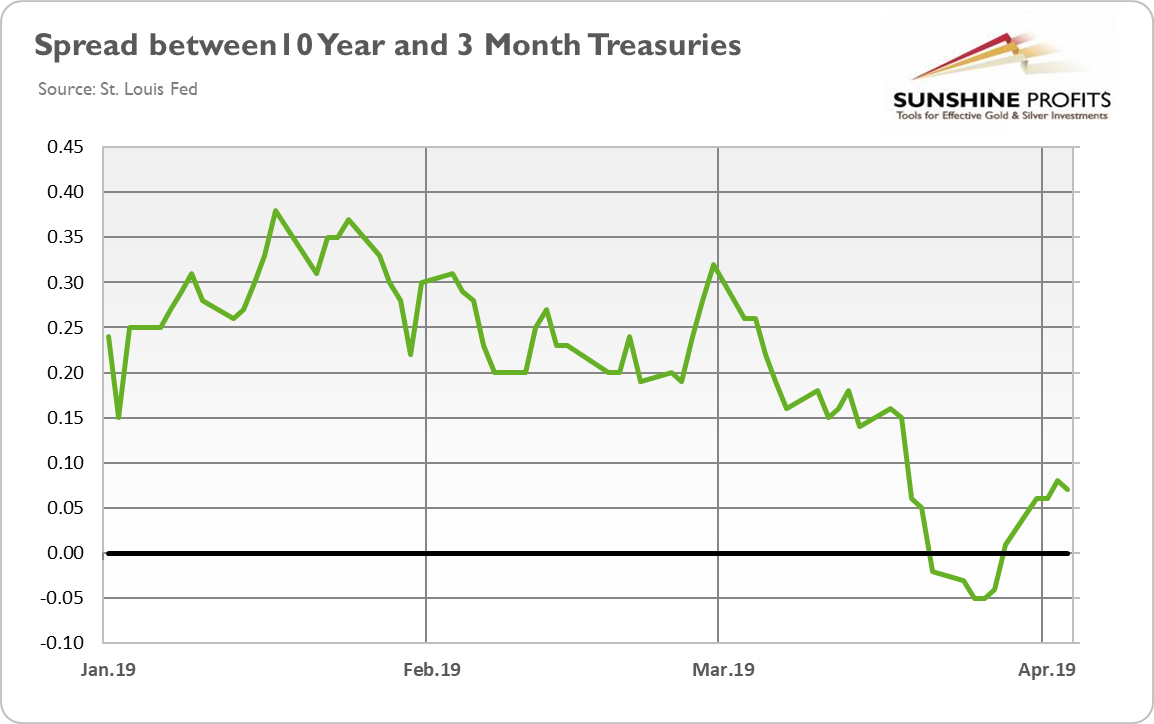
Indeed, the flush of new jobs kept the unemployment rate unchanged at 3.8 percent. It means that the recent yield curve inversion has not been confirmed by the second most important recession indicator. Actually, the yield curve has already returned into a positive territory, as one can see in the chart below.
Chart 2: US Treasury yield curve (spread between US 10-year Treasury and 3-Month Treasury) from January 2 to April 4, 2019

It suggests that we were right warning the precious metals investors (here and here) that the yield curve has lost some of its predictive power, so its inversion did not have to signal the imminent recession. Of course, the yield curve may return into negative territory – and then it could be worrying. However, the inversion did last only five days (you can barely spot it in the long-term chart), while before the two last recessions the yield curve stayed below zero for several months. Hence, it seems that it will turn out to be a false positive and gold bulls will have to wait longer to see a full-blown US recession. The recovery in China factory activity surveys confirms our analysis in the latest Market Overview that the current global slowdown might be temporary.
Implications For Gold
The latest Employment Situation report shows the boomerang in hiring, indicating that the US labor market tightened further after a sluggish start to the beginning of the year. We are not saying that everything is rosy – for example, the retail sales fell in February for the second time in three months. However, the unemployment rate remained flat, while the yield curved ceased to be inverted. It suggests that the US recessionary risk has recently abated, which should ease the save-haven demand for gold.
However, this week may be volatile in the precious metals market. On Wednesday, the Fed will publish the minutes of its latest monetary policy meeting, while the Governing Council of the ECB will gather again. No policy changes are expected at the ECB meeting, but if Draghi surprises on the dovish side, the euro may weaken against the dollar, which could very well pull down the yellow metal as well.
And also on Wednesday, there will be summit of the European leaders to discuss Brexit. As a reminder, Britain’s departure is now set for April 12. Yes, on that Friday – and there is no agreement yet, so the scenario of hard exit is more and more likely (although we bet that the UK will get an extension of the deadline). If this happens, we could see a lot of volatility in the gold market. At the end of the week, the picture should be much clearer – stay tuned!
Disclaimer: Please note that the aim of the above analysis is to discuss the likely long-term impact of the featured phenomenon on the price of gold and this analysis does not indicate (nor does it aim to do so) whether gold is likely to move higher or lower in the short- or medium term. In order to determine the latter, many additional factors need to be considered (i.e. sentiment, chart patterns, cycles, indicators, ratios, self-similar patterns and more) and we are taking them into account (and discussing the short- and medium-term outlook) in our trading alerts.
