Who is Kevin Hassett? Wolfe looks at the Trump ally tipped to become Fed Chair.
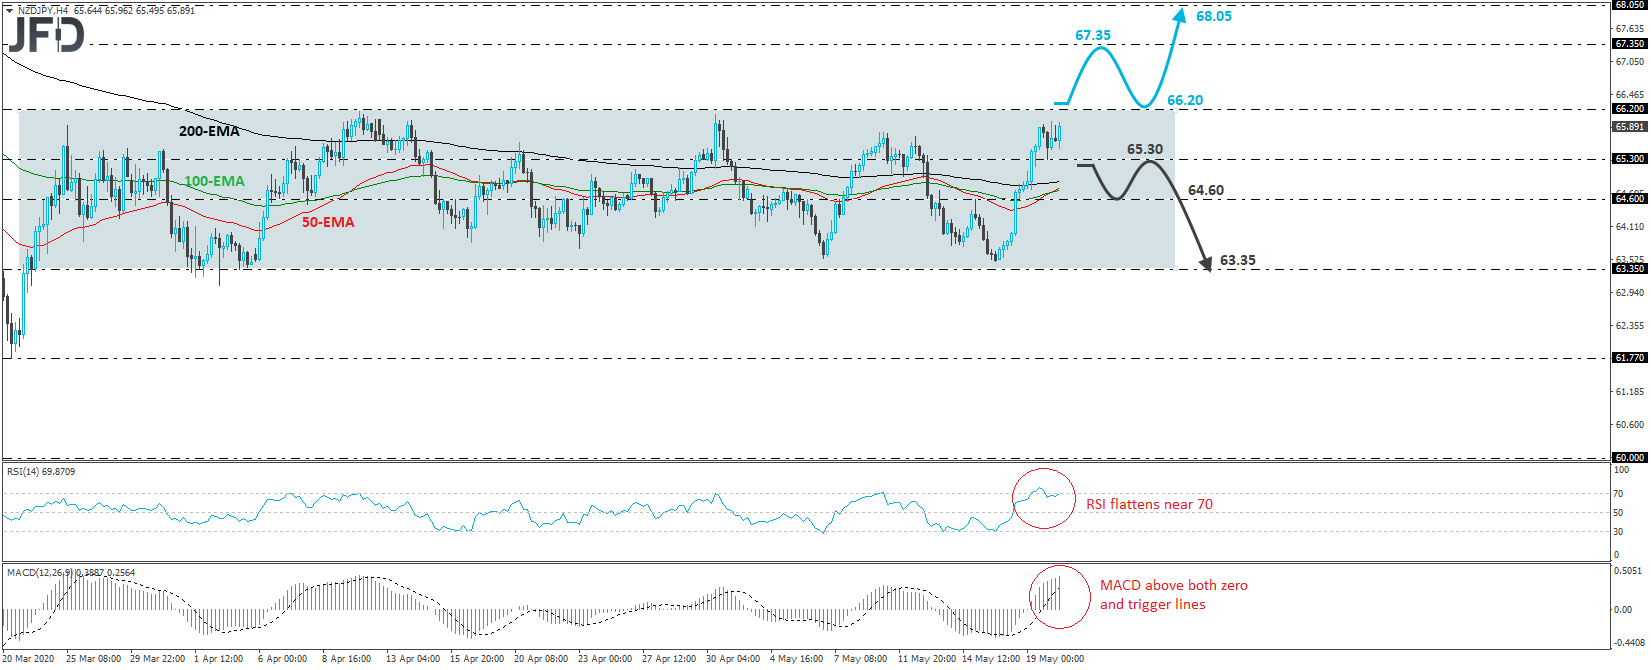
NZD/JPY traded slightly higher on Wednesday after it hit support at 65.30 on Tuesday. Overall, the rate continues to trade within a sideways range, between 63.35 and 66.20, since March 23rd and thus, despite its proximity to the upper end, we prefer to remain neutral for now.
In order to start examining higher areas, we would like to see the bulls pushing through the upper end of the range, at 66.20. Such a move would confirm a forthcoming higher high and may allow advances towards the high of March 6th, at 67.35. The bulls may decide to take a break after hitting that zone, but as long as a potential retreat stays above the upper bound of the range, we would see decent chances for another leg north, which could perhaps overcome the 67.35 zone this time around.
If indeed, this is the case, we would consider our next resistance to be near 68.05, a barrier marking the peak of March 3rd.
Taking a look at our short-term oscillators, we see that the RSI exited its above-70 zone and now stands flat near that level, while the MACD lies above both its zero and trigger lines, but shows signs of flattening as well. Both indicators detect slowing upside speed, enhancing our choice to wait for a break above 66.20 before getting confident on upside extensions.
On the downside, a break below 65.30 may signal that traders want to keep this pair range-bound for a while more, thereby allowing declines within the range. The first support to consider could probably be the 64.60 level, marked by the inside swing high of May 15th, the break of which may pave the way towards the lower boundary of the range, at around 63.35.
