⭐ Start off 2025 with a powerful boost to your portfolio: January’s freshest AI-picked stocksUnlock stocks

Will Last Week’s Rebound Continue This Week?

Published 02/22/2016, 07:12 AM
Updated 07/09/2023, 06:31 AM
VTI
-
VWO
-
VNQ
-
PICB
-
VEA
-
DJP
-
BND
-

Stock markets around the world bounced last week, based on a set of proxy ETFs representing the major asset classes. Breaking with the recent bias for selling risk, global equities (along with REITs and US high-yield bonds) posted solid gains for the shortened four-day trading week in the US through Feb. 19.

Last week’s leader: US real estate via the Vanguard REIT (N:VNQ), which added 4.3%. The biggest loser last week: foreign corporate bonds via PowerShares International Corp Bond (N:PICB), which eased 0.6% for the four trading days through Feb. 19.

The tailwind lifted an ETF-based version of the Global Market Index (GMI.F). This passively managed benchmark that holds all the major asset classes in market value weights rebounded handsomely last week, rising 1.9%.
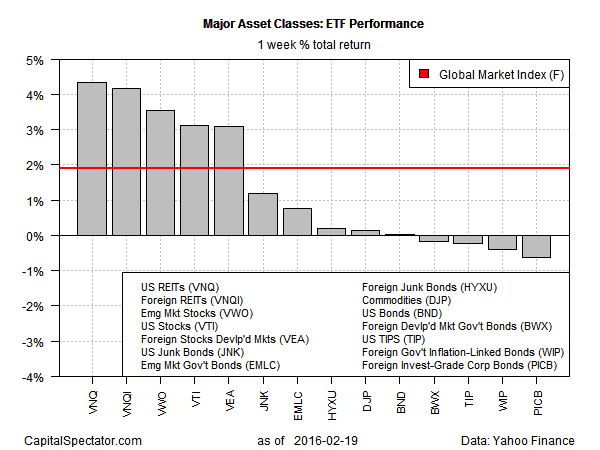
Major Asset Classes: ETF Performance 1-W % Total Return

Despite last week’s risk-on revival, trailing one-year total returns remain overwhelmingly in the red for most of the major asset classes and GMI.F. Although last week’s results pare the declines, most of the major asset classes remain firmly under water across the 252 trading days through Feb. 19.

Broadly defined commodities (via iPath Bloomberg Commodity Total Return Exp 12 June 2036 (N:DJP)) continue to suffer the biggest setback, sliding more than 30% as of last Friday. US investment-grade bonds are the lone exception for the annual comparison at the moment. Vanguard Total Bond Market (N:BND) is ahead by 1.8% for the trailing one-year period.
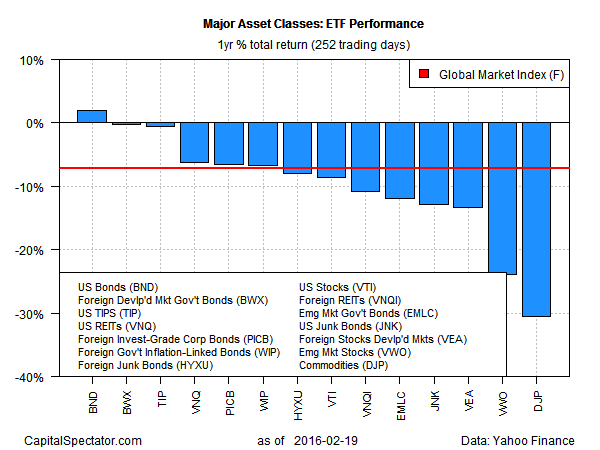
Major Asset Classes: ETF Performance 1-Y Return

The big question for the week ahead: Is the latest round of firmer pricing a sign that a degree of stabilization is unfolding in the markets after a rough start to 2016? Or is last week’s pop another installment of the dead-cat bounce?

One reason for remaining cautious: negative momentum continues to dominate pricing behavior for the major asset classes. For instance, the 50-day moving averages for the three equity ETFs in the charts above that represent global stocks—VTI, VEA, and N:VWO—remain below the respective 200-day averages. In other words, interpreting last week’s bounce as the start of a sustained rally for risky assets still falls into the category of speculation at the moment.

Will the long odds for thinking otherwise find more support this week?

Latest comments

Loading next article…
Risk Disclosure: Trading in financial instruments and/or cryptocurrencies involves high risks including the risk of losing some, or all, of your investment amount, and may not be suitable for all investors. Prices of cryptocurrencies are extremely volatile and may be affected by external factors such as financial, regulatory or political events. Trading on margin increases the financial risks.
Before deciding to trade in financial instrument or cryptocurrencies you should be fully informed of the risks and costs associated with trading the financial markets, carefully consider your investment objectives, level of experience, and risk appetite, and seek professional advice where needed.
Fusion Media would like to remind you that the data contained in this website is not necessarily real-time nor accurate. The data and prices on the website are not necessarily provided by any market or exchange, but may be provided by market makers, and so prices may not be accurate and may differ from the actual price at any given market, meaning prices are indicative and not appropriate for trading purposes. Fusion Media and any provider of the data contained in this website will not accept liability for any loss or damage as a result of your trading, or your reliance on the information contained within this website.
It is prohibited to use, store, reproduce, display, modify, transmit or distribute the data contained in this website without the explicit prior written permission of Fusion Media and/or the data provider. All intellectual property rights are reserved by the providers and/or the exchange providing the data contained in this website.
Fusion Media may be compensated by the advertisers that appear on the website, based on your interaction with the advertisements or advertisers.
© 2007-2025 - Fusion Media Limited. All Rights Reserved.