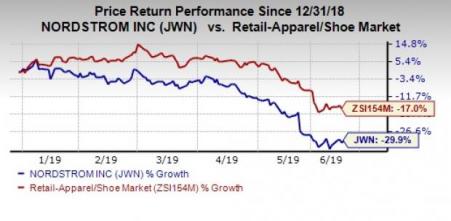
Nordstrom, Inc. (NYSE:JWN) has been losing investors’ confidence due to strained gross margin trend and dismal first-quarter fiscal 2019 results. Consequently, the company trimmed its sales and earnings guidance for the fiscal year, which further weighed on investors’ sentiments.
Driven by such factors, shares of this Zacks Rank #5 (Strong Sell) company have lost 29.9% year to date, wider than the industry’s 17% decline.

Let’s Delve Deeper
Nordstrom has been witnessing soft gross margin for a while now, owing to higher expenses. In first-quarter fiscal 2019, gross margin contracted 60 basis points (bps) mainly on account of anticipated markdowns to realign inventory to sales trends and higher occupancy expenses. Although the company expects gross profit to be almost flat year over year in fiscal 2019, it assumes lower sales, which might dent gross margin.
Notably, Nordstrom’s aforementioned growth strategy focused on enhancement of digital experience and increased investments in supply chain bodes well for the long term. However, investments related to occupancy, technology, supply chain and marketing have resulted in increased near-term costs. In first-quarter fiscal 2019, selling, general and administrative expenses, as a percentage of sales, rose 168 bps, primarily owing to higher fixed costs on lower sales.
Rise in supply chain costs, reflecting higher fulfillment and delivery expenses in relation to digital growth, is leading to higher expenses and weighing on its margins. Notably, management expects to incur $35 million as pre-opening costs for the opening of a women's store in New York this October. All these expenses might weigh on the company’s margins and profitability. For fiscal 2019, management expects moderately higher SG&A expenses.
Nordstrom reported lower-than-expected top and bottom lines in the fiscal first quarter. While the company’s earnings missed the Zacks Consensus Estimate after four consecutive beats, sales lagged estimates for the second straight quarter. Earnings and sales decreased on a year-over-year basis. The results were mainly hurt by persistent soft sales trends in full-price stores in the quarter. The company had certain executional misses with customer experience, which hurt sales in full-price and off-price stores, as well as online.
The top line was hurt by its loyalty program, digital marketing and merchandise. These three factors contributed to a slower rate of growth in digital sales, which grew just 7% in the fiscal first quarter. Net sales are now projected to remain flat to down 2% versus an increase of 1-2% projected earlier. Net credit card revenues are now expected to grow in low- to mid-single digits versus mid- to high-single-digit growth expected earlier. Further, the company expects EBIT of $805-$890 million while EBIT margin is anticipated to be 5.3-5.8%. Previously, it projected EBIT of $915-$970 million, with EBIT margin of 5.9-6.1%. It now envisions adjusted earnings per share of $3.25-$3.65 for fiscal 2019, down from $3.65-$3.90 projected earlier.
While the aforementioned factors make us apprehensive about the company’s performance, Nordstrom’s store-expansion efforts and customer-based strategy appear encouraging. This strategy focuses on three strategic factors, i.e. leveraging the company’s brand strength, providing excellent services and offering compelling products to customers. Nordstrom is focused on advancing in the technology space by boosting e-commerce and digital networks, as well as improving supply-chain channels and marketing efforts.
With regard to cost savings, the company plans to strike a balance between sales and expense growth. Apparently, it expects to accomplish savings associated with efficiency initiatives at the high end of $150-$200 million by fiscal 2019.
3 Better-Ranked Stocks in the Same Space
The Children's Place, Inc. (NASDAQ:PLCE) , sporting a Zacks Rank #1 (Strong Buy), has an expected long-term earnings growth rate of 8%. You can see the complete list of today’s Zacks #1 Rank stocks here.
Stitch Fix, Inc. (NASDAQ:SFIX) , which carries a Zacks Rank #2 (Buy), has an impressive long-term earnings growth rate of 22.5%.
Shoe Carnival (NYSE:CCL), Inc. (NASDAQ:SCVL) , also a Zacks Rank #2 stock, delivered average positive earnings surprise of 25.2% in the last four quarters.
Will you retire a millionaire?
One out of every six people retires a multimillionaire. Get smart tips you can do today to become one of them in a new Special Report, “7 Things You Can Do Now to Retire a Multimillionaire.”
Click to get it free >>
Nordstrom, Inc. (JWN): Free Stock Analysis Report
Shoe Carnival, Inc. (SCVL): Free Stock Analysis Report
Children's Place, Inc. (The) (PLCE): Free Stock Analysis Report
Stitch Fix, Inc. (SFIX): Free Stock Analysis Report
Original post
Zacks Investment Research
