Sorry King Midas, but nobody cares about what you touch anymore. That shimmery stuff you melt down to make rings and things has lost its luster. Gold was the talk of the town around $1,900 an ounce but since the collapse in prices now it's an afterthought. Which to me is baffling. I think that the real reason gold prices are not that high is the same reason people think that gold should be high. It’s all the "worthless" fiat currencies of the world. Globally we are printing money and devaluing currency. So the only thing on Earth that should be worth any money is a hard asset like gold, right? Sounds good in theory. But who are the major players in the gold market? Who buys the most gold? Central banks do. So now if your currency has depreciated then guess what you can't do? Buy as much gold as you used to. And the cycle continues...
Downward Channels
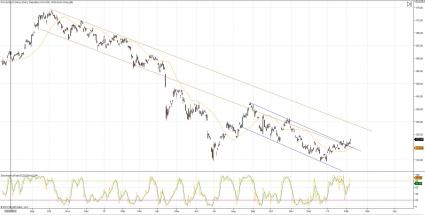
I am not bold nor crazy enough to come out and say that the tough times are behind us for the precious metals. I do, however, offer up a couple of charts that may change a few minds. First take a look at the gold chart using the exchange traded fund SPDR Gold Shares (GLD). From the October 2012 relative high near $175 we can draw a trend line channel across the first few tops. This trend was broken to the downside in April 2013, rendering these trend lines obsolete for the time being. Just for giggles though, let's extend these through today. More on this later.
Now let's fast forward to price action since September 2013. We can draw another channel coming down across the tops through January 2014 only to be violated at the beginning of February by continued bullish price action. This technical picture looks a lot different given this new set of circumstances. The chart changes from a downward death spiral to dead cat bounce with a side of optimism. Price sits above the 25x5 SMA and, more importantly, above the most recent downward price channel. To quote the great Jim Carey, "So you're saying there's a chance!" The next resistance sits at the extension of the downward trend line from the October 2012 high.
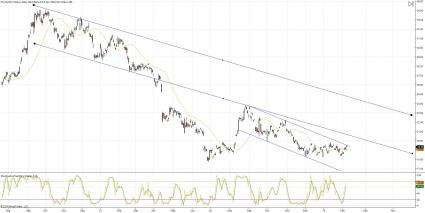
You can't talk gold without mentioning its hard-working, industrious, albeit less glamorous and attractive brother silver. On the charts silver and gold have a very high correlation. Economically this never really made sense to me as they have to very different sets of supply and demand determinants. Silver has industrial uses far above and beyond what gold has. Gold pretty much gets mined, shined, and showed off or buried. Silver is used to make all sorts parts from light switches to soldering applications to water purification. Regardless of what theory suggests, the chart moves pretty much in step with gold. As such, the silver chart has nearly the same pattern as gold but has not had the breakout yet from the major trend line resistance. Here we use the iShares Silver Trust (SLV) and can see it trading in the $19 handle down from an October 2012 high in the low $30s and a far cry from the all-time highs seen in April of 2011 in the $48 range.
Gold has a relatively high correlation with many metals, not just silver. My thinking is that if we see a recovery in gold prices it will spill over to silver, platinum, copper, aluminum and a host of other metals to a certain degree.
What if?
Entertain my wild ideas for a minute here. What if the pundits screaming "Gold is dead" are wrong? What if gold has seen the worst of its decline? What if the recent price action is the beginning of a gradual recovery in prices and not a dead cat bounce? What if there was a way to profit from this crazy notion other than buying GLD or SLV?
If you have never paid any mind to the miners then you might like what you're about to hear. By investing in a diversified mining operation we stand to make profits on a recovery in gold and silver prices but will still be insulated by exposure to other metals so it is not a "make or break" proposition. Further, we can use the Zacks Rank to uncover mining companies that have had the most positive earnings estimate revisions. Given the fact that miners have been relatively beat up during last year’s market rally we have the chance to find a few real bargains.
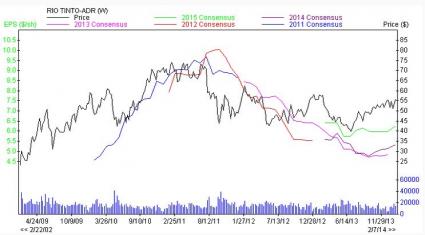
Rio Tinto PLC (RIO) is an international mining company with interests in mining for gold, silver, copper, coal, iron ore, uranium, zinc and a host of other metals. Fundamentally it's a Zacks #2 Rank. A quick look at the price and consensus chart gives me hope for the future. You can see the price tracked the consensus estimates and revisions relatively closely for the past four years. Estimates have slid along with prices for gold and silver since Q2 2011 and the stock sold off as a result. The recent consensus estimates have seen a bounce off the bottom as prices appear to be stabilizing. Should this trend continue it is very bullish for shares of RIO.
The technical chart on RIO reads bullish as well. The recent range from $51 to $57 looks to me like a consolidation after a big move from the low $40s. A break above $57 with volume would be a very bullish breakout. Failure to breakout would not be a sell signal but rather a chance to get in near the bottom of the recent consolidation range from $51-$53. A breakdown below $51 means you look for another stock to buy.
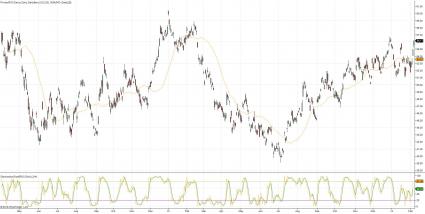
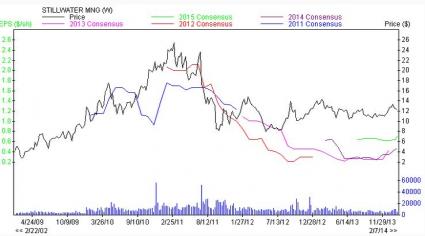
There is something about the name of this stock that soothes my nerves. Stillwater Mining Co (SWC) is engaged in mining operations in the Stillwater Complex in southern Montana. The area contains gold, copper, nickel, chromium, platinum and palladium. SWC is a Zacks #1 Rank and its last earning surprise was a whopping 425%. I want to show the price and consensus chart because it shares an important characteristic with RIO. Recent earnings revisions have seen upwards momentum for the first time since gold and silver began their decline. I think that a pattern is beginning to develop amongst analysts which only further supports the idea that gold may have already bottomed.
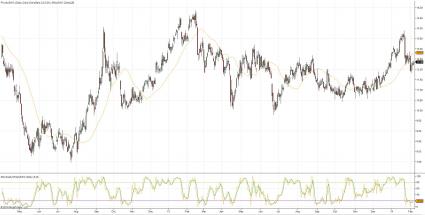
The price chart is temporarily bearish but that could change in a few days. I like the fact that the stochastics are oversold and awaiting a buy signal. I like the pull back and support at $12. What I don't like is the speed of the fall from mid-January to today and I don't like seeing the stock below the 25x5. This trade set up could take a couple weeks. I would need to see the stock get above the 25x5, pull back to it, then see a stochastic buy before I got on board. This is a perfect case of great fundamentals but I'll pass on the technicals right now. In mid-December the stock set up perfectly for a buy around $11 which took the stock near $14. But it is not mid-December, it's February so I would be patient for better technical timing.
If the first two examples were dipping your toes in the water on a possible gold rebound then this next stock is a cannonball from the high board. Franco Nevada Corp (FNV) is a gold focused royalty and stream company with some interests in platinum group metals. While this does not make it a 100% pure gold play, it does give it added risk to price movements in the base metal. The price and consensus chart looks the way you think it would given the other two examples. However, FNV has only been around since late 2011 so the chart is not as impactful. Being a newer operation, the analysts haven't quite figured things out and the estimates have been all over the place historically. Recently, upwards revisions of some magnitude have helped push FNV into a Zacks #2 Rank.
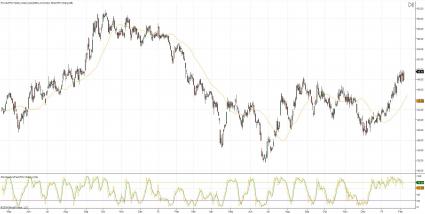
On my chart I like what I see. The stock pushed above resistance at $48 and had been consolidating. It rested firmly above the 25x5 while the 25x5 had a very positive slope. Stochastics were beginning to come down from overbought levels as the stock consolidated between $48 and $50. I would buy today's break out above $50. If you missed it, that's alright too, a better opportunity will come with a pull back to the 25x5 coupled by confirmation from the stochastics. It is a healthy technical chart with sound fundamentals behind it.
The bottom line is if you believe in a possible recovery in gold prices these three stocks are all good ideas. With a little bit of patience you can find favorable entry points that will offer up the best risk versus reward scenarios. If gold continues to unwind, hopefully the diversification in the first two stocks will cushion any downside and a wisely set stop loss will protect you on FNV. With the chart set up on gold and the earnings revisions by analysts I think there is a relatively strong case for at least a consolidation in gold prices if not a reversal of the long term down trend.
