The blogosphere seems to have gotten the idea that I am predicting $1000 as a sure thing. Nothing could be further from the truth. I've said many times in the past that I think there are parties trying to push gold to that level. Whether they succeed is anyone's guess, but I think they are clearly trying. I also believe that the bear market this past year was an artificial and manufactured move.
I've been very clear. On September 3 I recommended everyone exit all long positions in the metals and go to cash until gold either confirms that the bottom was formed on June 28th, or it makes it back down to $1030. That is the point where one could back up the truck so to speak.
In order to confirm that the bottom was made on June 28th gold needs to reverse the pattern of lower intermediate lows and lower intermediate highs. So far it hasn't even come close to doing that yet.
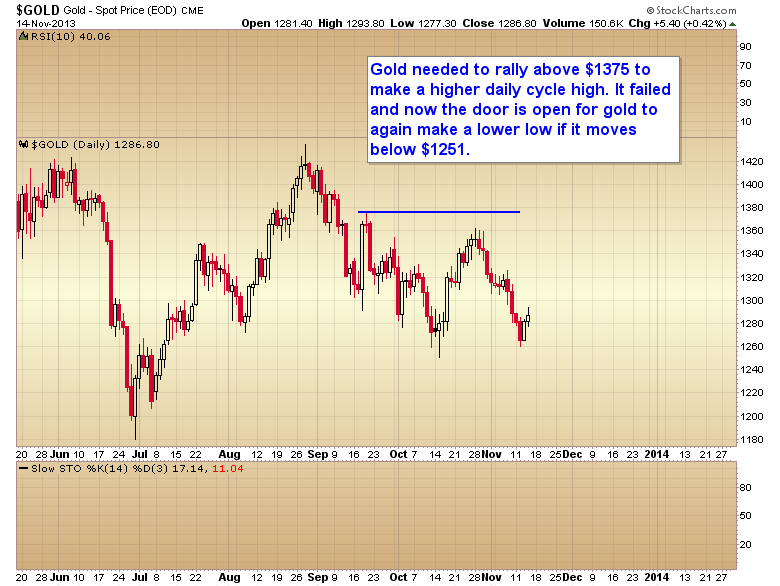
The first step in that direction would be for gold to form a higher daily cycle high. It had a chance to do that during the last daily cycle if gold could have moved above $1375. That cycle failed when it was only able to reach $1361 before the daily cycle rolled over and began moving down into its daily cycle low.
At this point the door is now open for gold to make another lower low if it drops below $1251.
If gold does drop below $1251 in the next few days it will confirm that the current intermediate cycle did not bottom in October and is still in progress. If this scenario comes to pass then the odds are going to go up significantly that gold will have a full test of the June low at $1179.
I also think if gold gets anywhere near $1179 we will have another one of those middle of the night attacks where 200-300 tons of gold are dumped on the market to run stops. Traders will wake up to positions already underwater, and the selling pressure will cascade until gold reaches the next major support zone. That support zone is the $1030 level that I have been talking about for months.
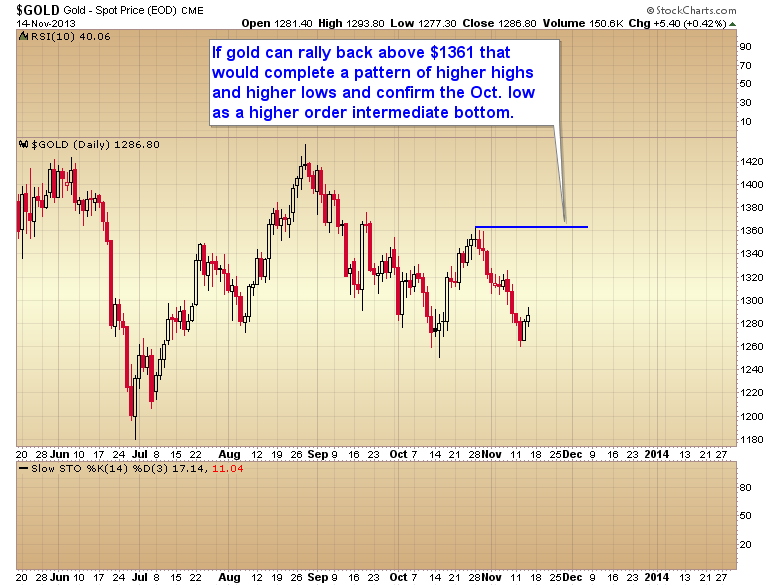
On the other hand if gold can rally back above $1361 then that would make a higher high and a higher low. That would reverse the down trend and it would also confirm that the low in October was a higher order intermediate degree bottom, and not just a minor daily cycle bottom. If gold can recover $1361 then I think that is the all clear signal and it's time to jump back in the pool.
As it stands today there is just no compelling reason to trade gold either short or long. The correct position is to sit in cash until we see which line is going to break first.
$1250 = bad times continue, and high odds of seeing $1030.
$1362 = the good times are here again. The bull has broken the manipulation.
Any directional trade while gold remains between those two lines is just a coin flip in my opinion. It could go either way. I just don't see any reason to risk capital on a coin flip when all one has to do is wait patiently for 5-10 days and they will have an answer with a high degree of certainty as to which way gold is going.
- English (UK)
- English (India)
- English (Canada)
- English (Australia)
- English (South Africa)
- English (Philippines)
- English (Nigeria)
- Deutsch
- Español (España)
- Español (México)
- Français
- Italiano
- Nederlands
- Português (Portugal)
- Polski
- Português (Brasil)
- Русский
- Türkçe
- العربية
- Ελληνικά
- Svenska
- Suomi
- עברית
- 日本語
- 한국어
- 简体中文
- 繁體中文
- Bahasa Indonesia
- Bahasa Melayu
- ไทย
- Tiếng Việt
- हिंदी
Will Gold Drop To $1000 Or Did It Bottom This Past Summer?
Published 11/17/2013, 02:02 AM
Will Gold Drop To $1000 Or Did It Bottom This Past Summer?
Latest comments
Loading next article…
Install Our App
Risk Disclosure: Trading in financial instruments and/or cryptocurrencies involves high risks including the risk of losing some, or all, of your investment amount, and may not be suitable for all investors. Prices of cryptocurrencies are extremely volatile and may be affected by external factors such as financial, regulatory or political events. Trading on margin increases the financial risks.
Before deciding to trade in financial instrument or cryptocurrencies you should be fully informed of the risks and costs associated with trading the financial markets, carefully consider your investment objectives, level of experience, and risk appetite, and seek professional advice where needed.
Fusion Media would like to remind you that the data contained in this website is not necessarily real-time nor accurate. The data and prices on the website are not necessarily provided by any market or exchange, but may be provided by market makers, and so prices may not be accurate and may differ from the actual price at any given market, meaning prices are indicative and not appropriate for trading purposes. Fusion Media and any provider of the data contained in this website will not accept liability for any loss or damage as a result of your trading, or your reliance on the information contained within this website.
It is prohibited to use, store, reproduce, display, modify, transmit or distribute the data contained in this website without the explicit prior written permission of Fusion Media and/or the data provider. All intellectual property rights are reserved by the providers and/or the exchange providing the data contained in this website.
Fusion Media may be compensated by the advertisers that appear on the website, based on your interaction with the advertisements or advertisers.
© 2007-2025 - Fusion Media Limited. All Rights Reserved.
