Is the energy sector is showing signs of life again? Should investors trust this move?
We’ll let the price action speak for itself, but investors should get a signal soon.
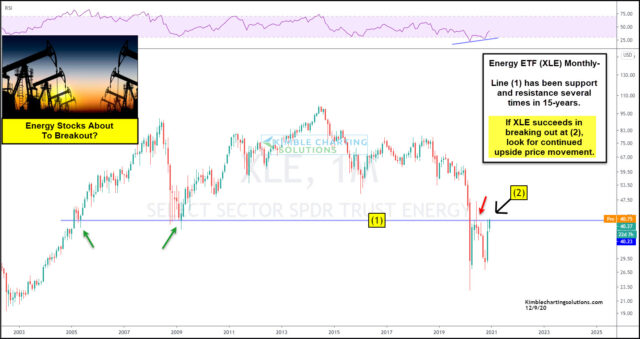
Today’s chart take a long-term “monthly” view of the Energy Sector ETF (NYSE:XLE) and highlights the current downtrend – as well as the recent rally.
The early year spike lows (coronavirus crash) were successfully retested this summer spurring a rally for XLE and energy stocks. XLE is now closing in on an important 15-year price support/resistance level at (1). The current rally is being fuelled by higher crude oil prices (now nearing $50) and a broader commodities rally. Looking at the chart, this looks like a big test for the out of favor Energy Sector (XLE).
If XLE succeeds in breaking out above (2), look for continued upside price movement.
