BTC/USD traded lower yesterday, breaking below the support (now turned into resistance) barrier of 53150. That said, the slide was stopped at 51300, and then, the price rebounded somewhat.
Overall, since hitting a record high at around 60624 on Mar. 15, the crypto has been printing lower highs and lower lows on the 4-hour chart, something suggesting that there may be more declines in the works for the near term.
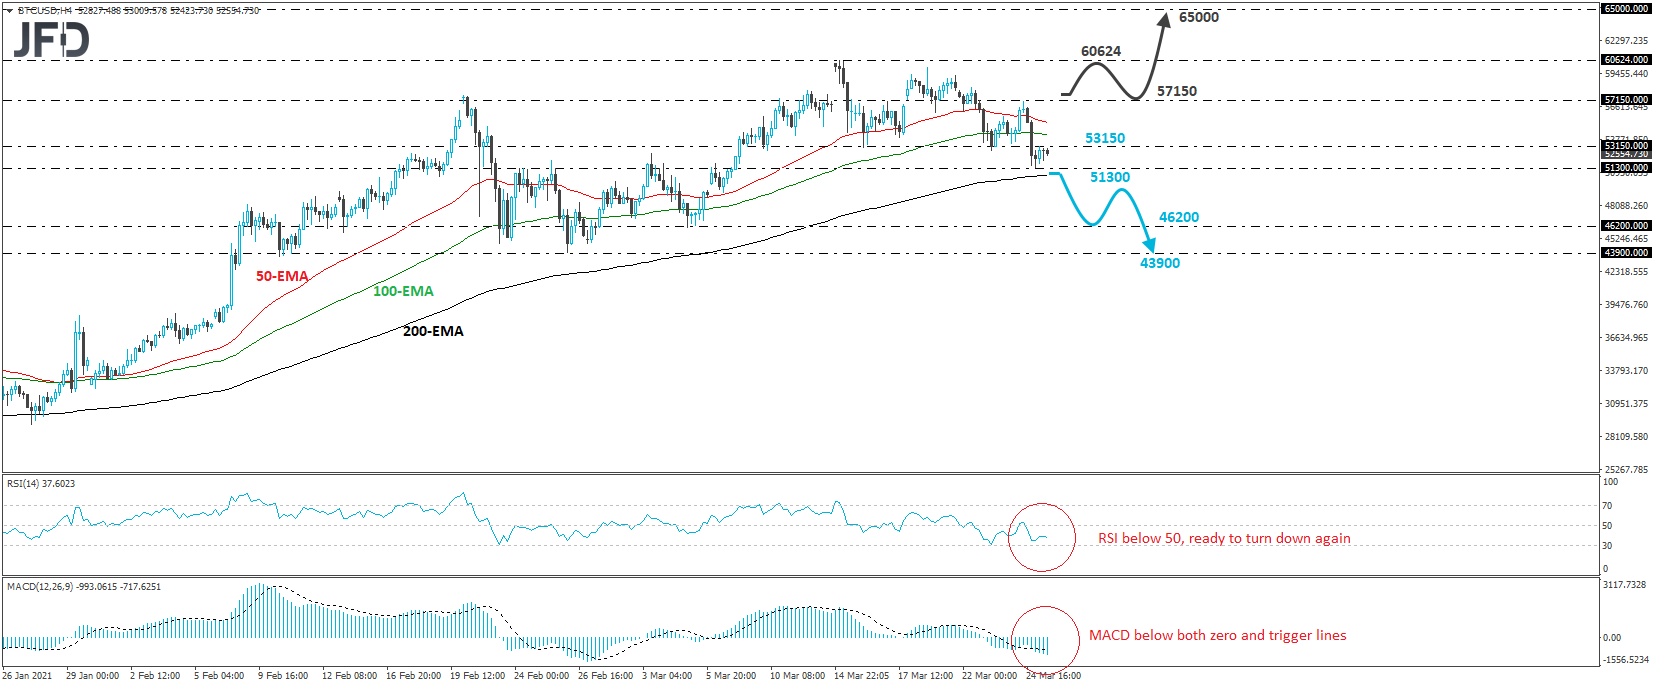
A decisive dip below 51300 would confirm the case for more declines and may set the stage for extensions towards the 46200 territory, which is defined as a support by the low of Mar. 5. If the bulls are not willing to jump into the action neither at that zone, then, the next support to consider may be the low of Feb. 26, at 43900.
Taking a look at our short-term oscillators, we see that the RSI, already below 50, has started to turn down again, while the MACD lies below both its zero and trigger lines, pointing down. Both indicators detect accelerating downside speed, which enhances to case for further declines in the short run.
Now, in order to start examining the bullish case again, we would like to see a recovery above the latest peak, at around 57150. This will confirm a forthcoming higher high on the 4-hour chart and may see scope for advances towards the all-time high of 60624. If that zone is not able to provide resistance this time around and breaks, then the crypto will enter uncharted territory with the next area to consider as a possible obstacle being the psychological zone of 65000.