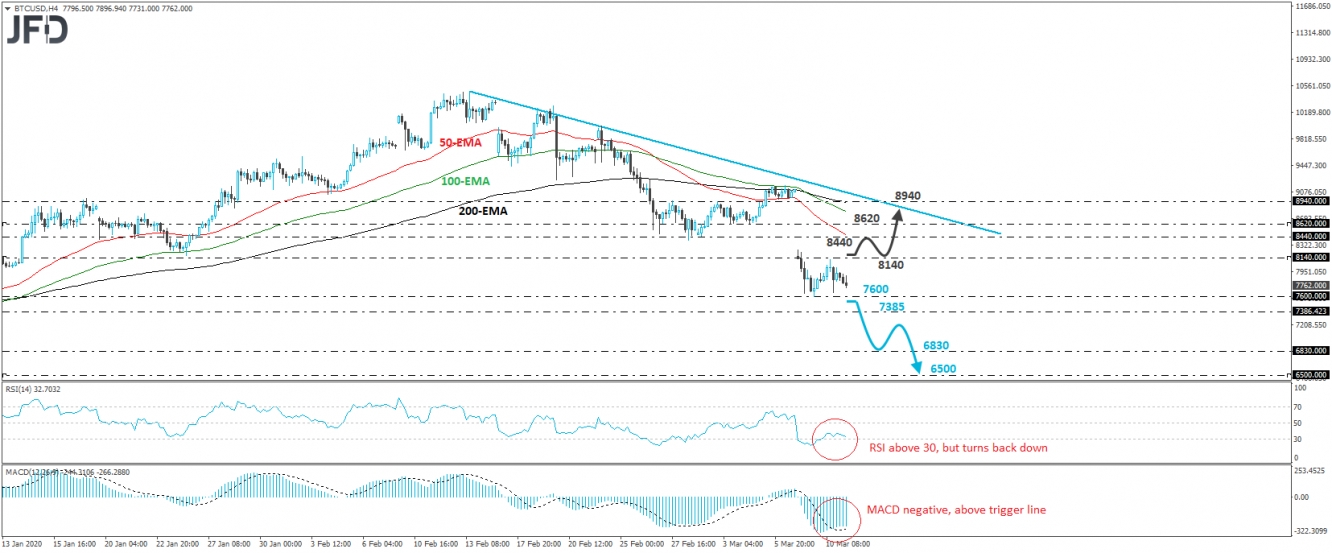
BTC/USD traded slightly lower today after it hit resistance at 8140 yesterday. Overall, the crypto has been printing lower lows and lower highs below a tentative downside resistance line since February 13th. Thus, we would consider the short-term outlook to be negative.
If the bears are willing to stay behind the steering wheel and push below Monday’s low of 7600, this would confirm a forthcoming lower low on the 4-hour chart and may initially target the 7385 zone, marked by the inside swing highs of December 30th and January 3rd. Another dip, below 7385 could carry larger bearish implications and perhaps pave the way towards the 6830 area, defined as a support by the lows of January 2nd and 3rd. If the bears are not willing to stop there either, we may then see them putting the 6500 hurdle on their radars. That barrier provided decent support on November 25th and December 17th.
Shifting attention to our short-term oscillators, we see that the RSI, although it recently exited its below-30 zone, it turned down again and appears ready to fall back below 30. The MACD is negative, above its trigger line, but shows signs that it could also turn down soon. Both indicators suggest that Bitcoin may start gaining downside speed again, which supports our view for further declines.
In order to start examining the case of a decent correction to the upside, we would like to see a rebound above 8140. Such a move may initially target the 8440 area, which acted as a support on February 28th and March 2nd, or the 8620 zone, marked by the lows of March 3rd and 4th. If the advance continues above that zone as well, then we may see it stopping near the aforementioned downside line or the 8940 territory, which provided resistance on February 27th and March 2nd.
- English (UK)
- English (India)
- English (Canada)
- English (Australia)
- English (South Africa)
- English (Philippines)
- English (Nigeria)
- Deutsch
- Español (España)
- Español (México)
- Français
- Italiano
- Nederlands
- Português (Portugal)
- Polski
- Português (Brasil)
- Русский
- Türkçe
- العربية
- Ελληνικά
- Svenska
- Suomi
- עברית
- 日本語
- 한국어
- 简体中文
- 繁體中文
- Bahasa Indonesia
- Bahasa Melayu
- ไทย
- Tiếng Việt
- हिंदी
Will Bitcoin Confirm A Lower Low?
Published 03/11/2020, 07:30 AM
Updated 07/09/2023, 06:31 AM
Will Bitcoin Confirm A Lower Low?
Latest comments
Loading next article…
Install Our App
Risk Disclosure: Trading in financial instruments and/or cryptocurrencies involves high risks including the risk of losing some, or all, of your investment amount, and may not be suitable for all investors. Prices of cryptocurrencies are extremely volatile and may be affected by external factors such as financial, regulatory or political events. Trading on margin increases the financial risks.
Before deciding to trade in financial instrument or cryptocurrencies you should be fully informed of the risks and costs associated with trading the financial markets, carefully consider your investment objectives, level of experience, and risk appetite, and seek professional advice where needed.
Fusion Media would like to remind you that the data contained in this website is not necessarily real-time nor accurate. The data and prices on the website are not necessarily provided by any market or exchange, but may be provided by market makers, and so prices may not be accurate and may differ from the actual price at any given market, meaning prices are indicative and not appropriate for trading purposes. Fusion Media and any provider of the data contained in this website will not accept liability for any loss or damage as a result of your trading, or your reliance on the information contained within this website.
It is prohibited to use, store, reproduce, display, modify, transmit or distribute the data contained in this website without the explicit prior written permission of Fusion Media and/or the data provider. All intellectual property rights are reserved by the providers and/or the exchange providing the data contained in this website.
Fusion Media may be compensated by the advertisers that appear on the website, based on your interaction with the advertisements or advertisers.
© 2007-2025 - Fusion Media Limited. All Rights Reserved.
