BTC/USD fell sharply yesterday and today after Elon Musk tweeted that Tesla (NASDAQ:TSLA) would stop accepting the cryptocurrency as payment for its cars. The tumble was stopped near the neckline of a possible “head and shoulders” pattern that seems to have been forming since early March. Although such formations tend to be bearish, we prefer to wait for its completion before getting confident for further declines. Thus, for now, we will take a neutral stance.
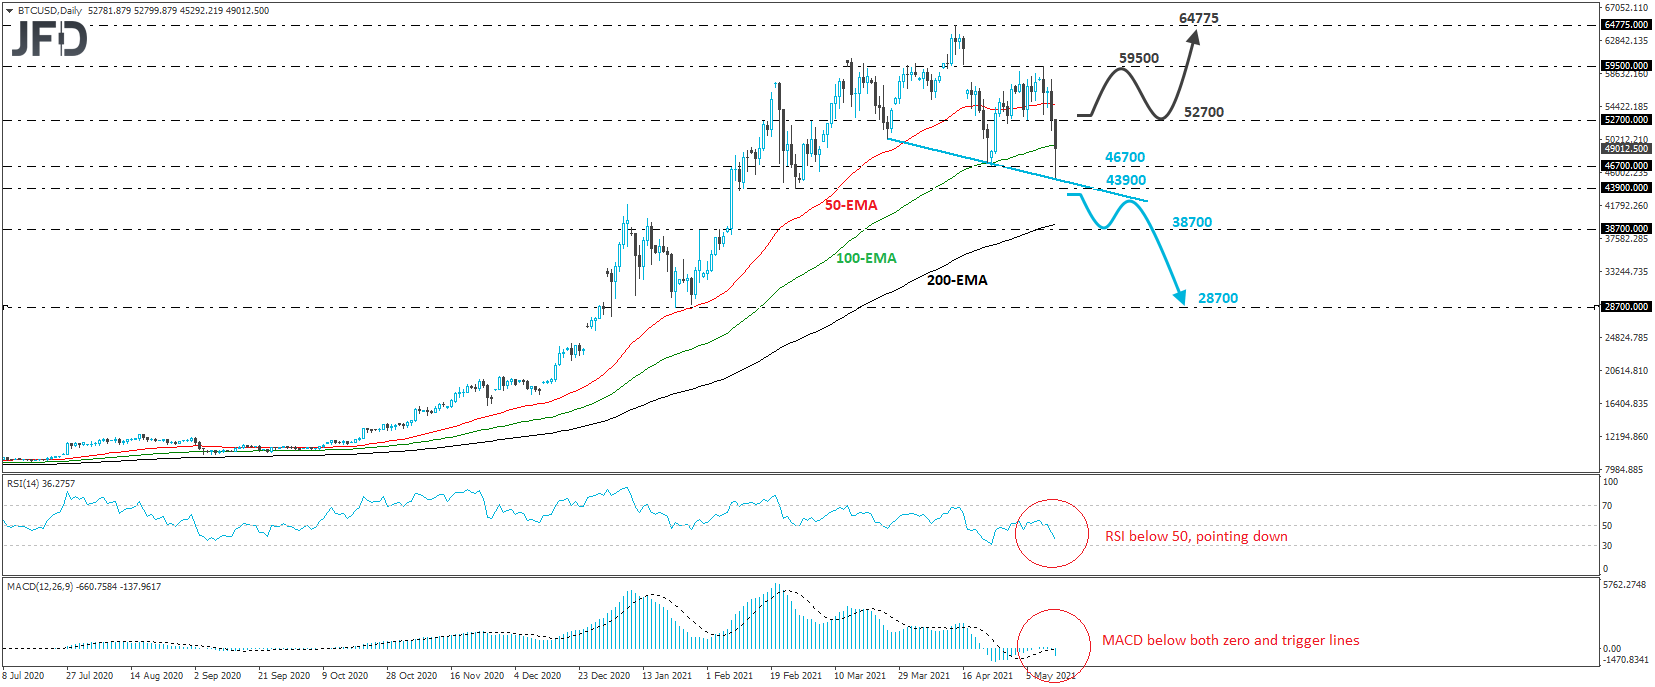
If indeed the bears stay in the driver’s seat and push the crypto below the H&S’s neckline and the 43900 zone, marked by the low of Feb. 26, more market participants may decide to sell, as this may be interpreted as a trend reversal signal. We may then see declines towards the 38700 area, marked by the inside swing high of Jan. 29, the break of which could carry larger bearish implications and perhaps pave the way towards the lows of Jan. 22 and 27, at around 28700.
Taking a look at our daily oscillators, we see that the RSI lies below 50 and points down, while the MACD runs below both its zero and trigger lines, pointing south as well. Both indicators detect increasing downside speed and add to the chances that we may see a H&S completion in the not-too-distant future.
On the upside, a recovery back above 52700, a resistance defined by the inside swing low of May 5, may discard the H&S pattern and perhaps encourage the buyers to push the action towards the peak of the right shoulder, at around 59500. If they are not willing to stop there, then we may see them sailing towards the crypto’s all-time high, at 64775, which was hit on Apr. 14.