Will Alphabet Stock Go for A New Record High?

Published 02/02/2021, 07:22 AM
Updated 07/09/2023, 06:31 AM

Alphabet (NASDAQ:GOOGL) opened with a positive gap on Monday, and continued trading north throughout the session, overcoming last Thursday’s high of 1885. Overall, the stock continues to balance above the upside support line drawn from the low of Sept. 23, and thus, we would consider the outlook to be positive.

Today, the company reports its earnings results for Q4 FY 2020. Expectations are for a small rise in earnings per share, although revenue is forecast to grow at the fastest pace in four quarters. Market participants may also pay extra attention to cloud revenue, as those operations have grown fast, especially in the midst of the coronavirus pandemic, due to a lot of employees working from home. The forecast is for cloud revenue to have grown at a healthy pace, but a slower one compared to Q4 FY 2019.

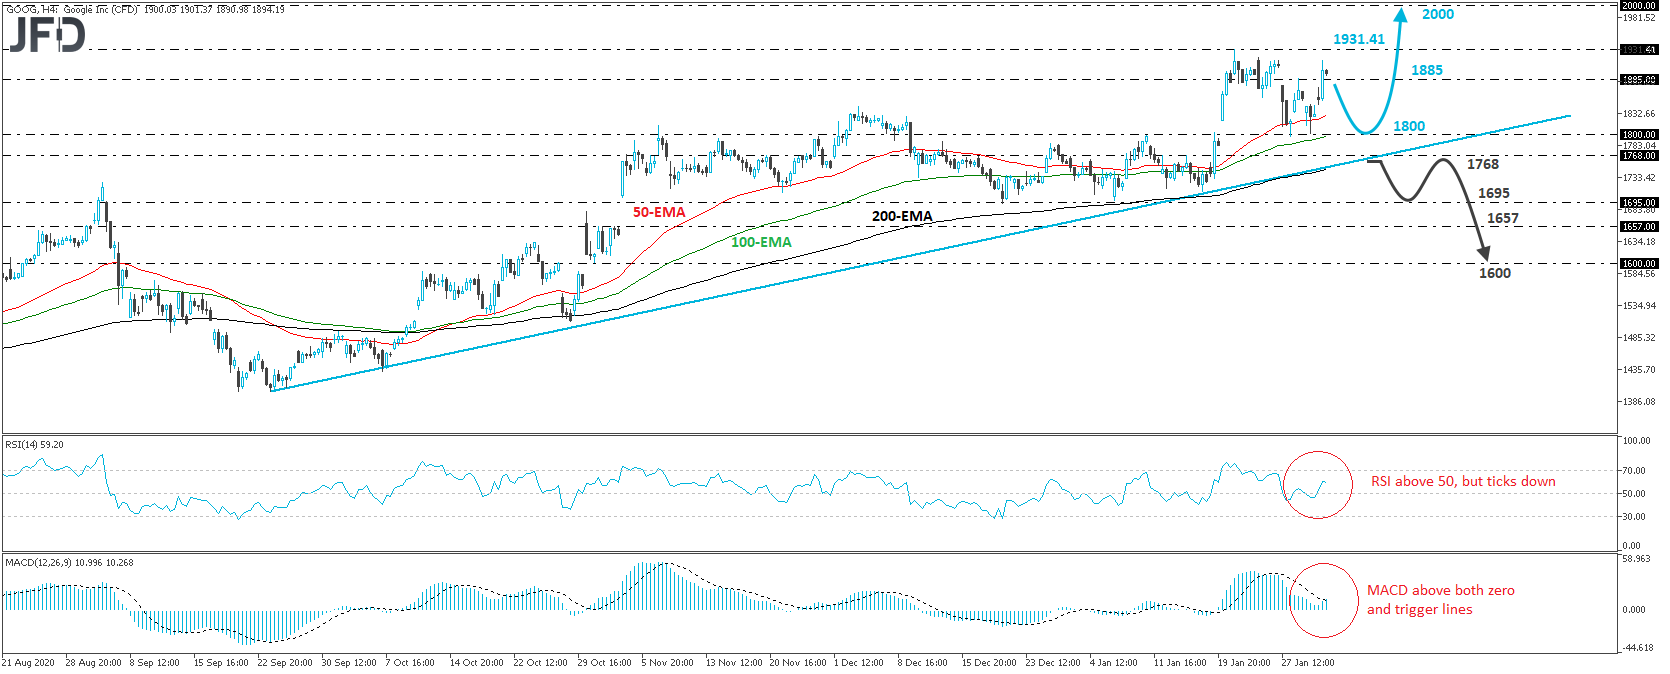
If the results top market expectations, we may see the stock touching its all-time high again, at 1931.41, hit on Jan. 21. If investors are not willing to liquidate near that level this time around, a break higher may see scope for extensions towards the psychological round figure of 2000.

Turning our gaze to our short-term oscillators, we see that the RSI runs above 50, while the MACD, already positive, has just poked its nose above its trigger line. Both indicators detect upside speed, corroborate the notion for further advances. Nonetheless, the RSI has just ticked down, suggesting that a corrective setback may occur before the next leg north.

Having said that, in order to abandon the bullish case, we would like to see the stock falling below 1768. Such a move may also take the share below the upside support line taken from the low of Sept. 23, and may initially target the 1695 level, marked by the lows of Dec. 21 and Jan. 6, or the 1657 area, marked by the highs of Nov. 2 and 3. If neither support zone is able to halt the slide, then a break lower may pave the way towards the low of Oct. 30, at 1600.
Alphabet Google stock 4-hour chart technical analysis

Latest comments

Loading next article…
Risk Disclosure: Trading in financial instruments and/or cryptocurrencies involves high risks including the risk of losing some, or all, of your investment amount, and may not be suitable for all investors. Prices of cryptocurrencies are extremely volatile and may be affected by external factors such as financial, regulatory or political events. Trading on margin increases the financial risks.
Before deciding to trade in financial instrument or cryptocurrencies you should be fully informed of the risks and costs associated with trading the financial markets, carefully consider your investment objectives, level of experience, and risk appetite, and seek professional advice where needed.
Fusion Media would like to remind you that the data contained in this website is not necessarily real-time nor accurate. The data and prices on the website are not necessarily provided by any market or exchange, but may be provided by market makers, and so prices may not be accurate and may differ from the actual price at any given market, meaning prices are indicative and not appropriate for trading purposes. Fusion Media and any provider of the data contained in this website will not accept liability for any loss or damage as a result of your trading, or your reliance on the information contained within this website.
It is prohibited to use, store, reproduce, display, modify, transmit or distribute the data contained in this website without the explicit prior written permission of Fusion Media and/or the data provider. All intellectual property rights are reserved by the providers and/or the exchange providing the data contained in this website.
Fusion Media may be compensated by the advertisers that appear on the website, based on your interaction with the advertisements or advertisers.
© 2007-2025 - Fusion Media Limited. All Rights Reserved.