In the first part of this research article, we attempted to provide some details to the question of “ sector trends in 2021 and what may shift over the next 10 to 12+ months”. In that section of this article, we covered the broad market sector trends and highlighted how the COVID-19 virus event changed the way the global economy functioned for 8+ months. It also highlighted a number of trends that were already taking place in the global market—Technology, Healthcare, Discretionary, and Comm. Services. Quite literally, the past 20+ years have been a digital revolution for most of the world and that is not likely to change.
What will likely change is the demand for Commodities, Raw Materials, Agriculture, and Manufacturing/Distribution related to these core materials. We believe any resurgence of the global economy post-COVID-19 will consist of a resurgence in the demand for commodities and raw/basic materials as consumers extend their normal consumption growth at exceptional rates.
The question in our minds is how will this transition take place and over how much time? Will it happen suddenly as new global policy and restructuring take place? Will it happen more slowly as the global economy re-engages and rebuilds? Will it happen aggressively, disrupting other sector trends? Will it happen in a way that supports continued growth and appreciation of major sector trends?
All of these questions are yet to be answered, but we believe the Commodities, Basic Materials, Manufacturing bullish trend is already starting and will, eventually, become a very strong focus for global investors.
Trading Volume & Volatility Surging
In the first part of our research, we highlighted how the SPY vs. the QQQ trends since 2009 have diverged. The SPY has, for the most part, stayed very aligned to the initial YELLOW trend channel that originated from the 2009 bottom. Whereas the QQQ has continued to rally away from a similar trend channel/line. This suggests that global investors poured greater amounts of capital into the technology sector over the past 10+ years chasing technology growth and expansion. Will this continue and how will a Commodity rally change how capital is invested?
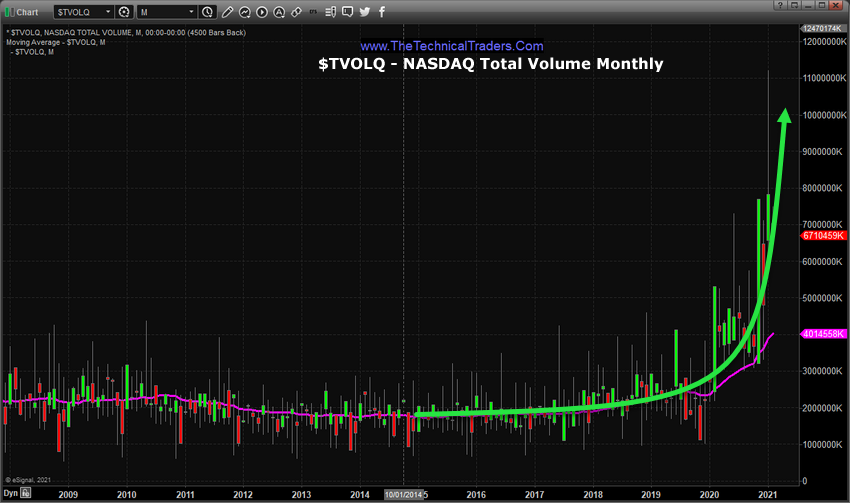
Global market volatility and trading volume have skyrocketed over the past 10+ months. We’ve seen the VIX move higher (from average low levels near 11 to average low levels near 22). We’ve also seen Average Daily Volume increase by more than 30% (using $TVOL averages) over the past 5+ years. Certainly, quite a bit of capital is working hard in the markets to execute profitable outcomes. This capital will continue to redeploy in the markets as sectors shift.

Custom Volatility Index Suggests Market Breakout May Happen Soon
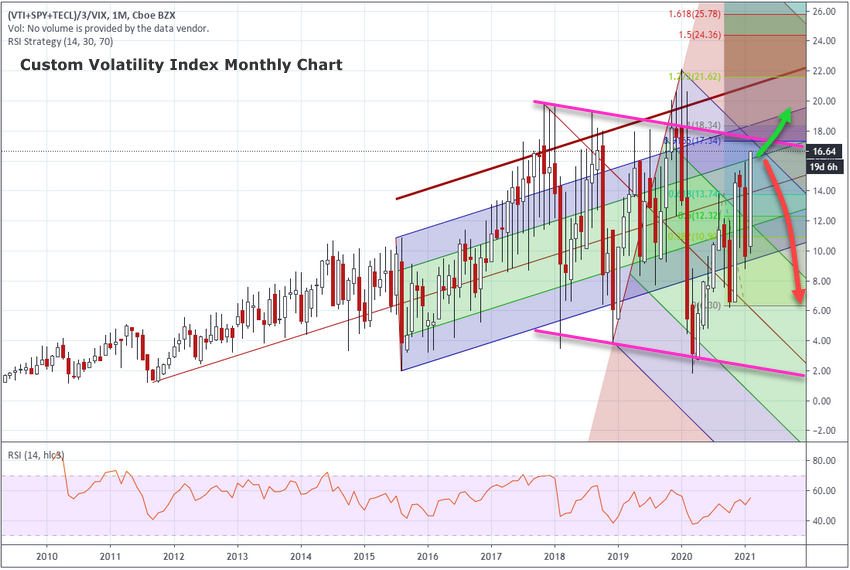
We’ll start by reviewing our Custom Volatility Index Monthly chart and highlighting two key functions at play on this chart. First, as you may be able to see from the longer-term (2010 to 2019) trend—we’ve experienced a broad market appreciation phase over that span of time where the Custom Volatility Index rallied higher and higher, establishing a very clear upward price channel (pitchfork). Recently, the COVID-19 virus event broke that channel and established a new downward price phase—which has yet to be broken.
It is our opinion that any resurgence in the global economy as a result of the new COVID-19 vaccines and other medical advancements may prompt a very big upside breakout trend in the global markets. As you can see from this chart, the upper MAGENTA line creates the upper boundary for the downward sloping channel on this Custom Volatility Index chart. If that MAGENTA level is breached by a strong rally in the global markets (and a decreasing VIX/volatility level), then we will have broken the downward channel and resumed the upward channel – this is a huge advancement/breakthrough for price trend.
If this breakout in the Custom Volatility index fails, then we may see a more aggressive disruption in current sector trends as the market attempt to revalue support and expectations as a result of this disruption. It is very likely that this breakout may happen before the end of March 2021—so be prepared as we are nearing a very critical juncture in this continued bullish trend which may result in a wild increase in volatility and trend rotation.

Commodity Index Poised For A Breakout
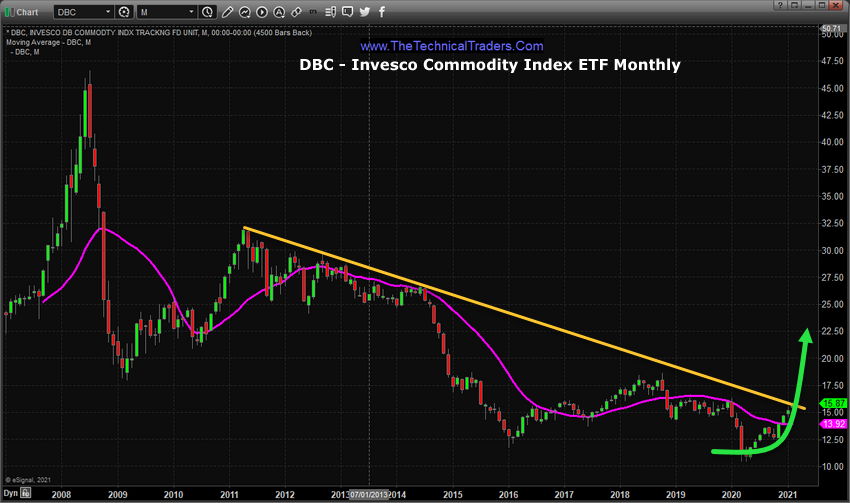
Finally, the chart that paints a very clear picture for all of you—the Invesco Commodity Index chart that highlights how close we are to a disruption in these trends. This Monthly Invesco Commodity Index chart highlights the downward sloping price channel off the recent highs (going back to 2011—similar to the trend channel levels on the SPY/QQQ charts from Part I). The continued downward price cycle on this Commodity Index chart appears to be ready for a breakout rally to take place and, if this happens within the next 2 or 3 months, could prompt a disruption in other major sector trends as investors will suddenly realize the Commodity sectors could rally 45% to 75% (or more) very quickly.
Additionally, if this rally is supported by a resurgence in global manufacturing and strengths in other major sectors (infrastructure, healthcare, automotive and building), then we may see a broad shift in how capital is deployed in the global markets happen fairly quickly.

Granted, we are showing you Monthly charts, so “fairly quickly” could be 3 to 6+ months. But the potential for this shift taking place in 2021 seems to be setting up right now. The Custom Volatility Index chart suggests a breakout or breakdown trend is about to setups. The Invesco Commodity Index suggests commodities are about ready to break out above a very strong downward price channel. The SPY and QQQ are both rallying above the longer-term support channel—suggesting a broad market rally may be establishing a strong footing. And sectors such as Commodities, Raw Materials, Agriculture, and Manufacturing/Distribution may suddenly experience a resurgence as demand for commodities pushes real inflation into the mix.
Inflation becomes an issue for global investors and central banks because moderate inflation is good. Excessive inflation is a horrible thing for any society. Global Central Banks will do everything possible to stop run-away inflation if it happens, and this usually means Precious Metals and the US Dollar will skyrocket as strong inflation pushes global credit market concerns to the limits.
From 1980 to 1985, we experienced an inflationary event that prompted the US dollar to rise from levels near 85 to a peak above 160. At that same time, actually starting just before 1978. Gold rallied from levels near $160 to reach a peak of almost $873 in January 1980. This reaction in the US Dollar and Gold was directly related to the fear and uncertainty generated by a breakout rally in Commodity prices that started in late 1978 and ended in 1981 when Commodities rallied nearly 70%. The rally in commodities disrupted global finance/banking/credit and prompted strong inflationary trends that prompted the US Federal reserve to raise interest rates above 16%—the highest Fed rates in history.
