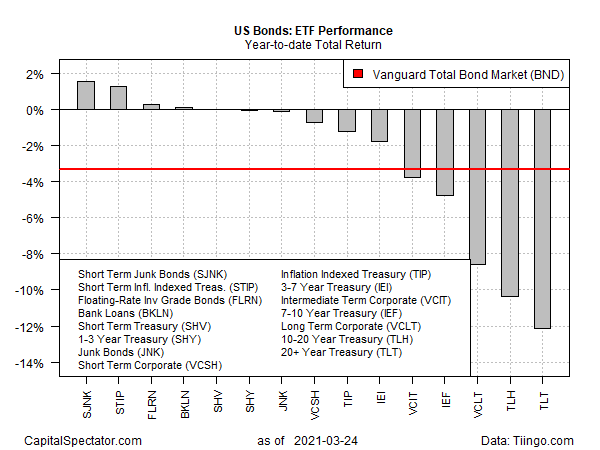
Holding bonds has been a mostly painful experience so far in 2021, although a few corners of fixed-income have escaped the damage, based on a set of proxy ETFs through yesterday’s close (Mar. 24).
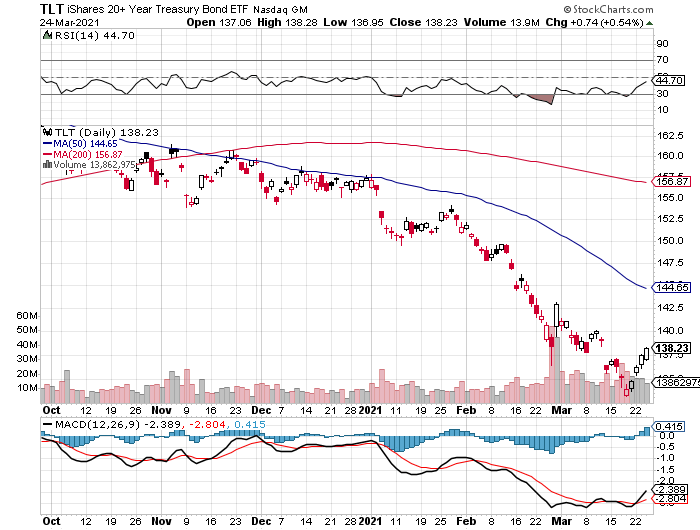
The usual suspects, however, are seeing deep shades of red. The worst-hit sectors are long Treasuries. The iShares 20+ Year Treasury Bond ETF (NASDAQ:TLT) has tumbled 12.2% so far this year.

Animating the selling is the growing perception that the Federal Reserve’s remit is shifting to maximizing employment while de-emphasizing inflation control. That’s been a mostly academic change so far since inflation has been low in recent years and knocked lower by the pandemic. But Wall Street is anxious that as the coronavirus crisis fades, combined with aggressive fiscal stimulus and dovish central bank policy for the foreseeable, the potential is rising for higher inflation. If so, the prospect of a Fed that’s disinclined to pre-emptively maintain pricing stability is worrying the market.
“The market is still coming to terms with the fact that this Fed is going to be focused on maximizing employment and is going to let inflation run,” says Patrick Leary, chief market strategist and senior trader at Incapital. Yields are “still overall low enough for the Fed; whether that will change at some point and what those numbers are, we don’t really know,” he adds.
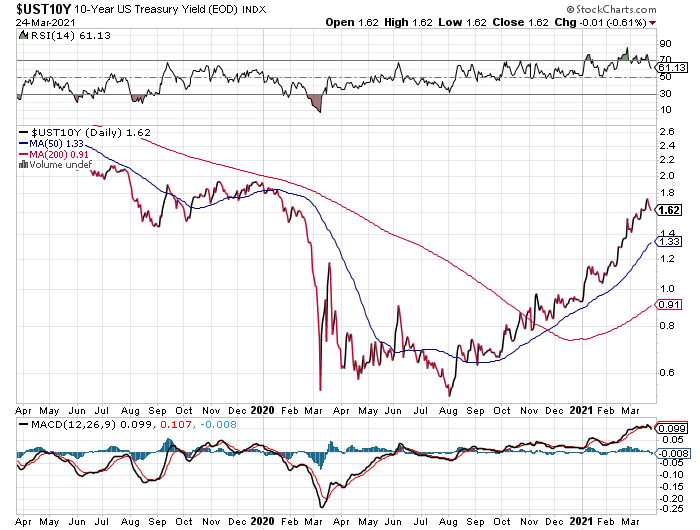
As usual with the perception of greater uncertainty and higher stakes, the crowd requires deeper discounting of risk assets as compensation. For bonds, that translates to lower prices and a commensurate rise in yields. The benchmark 10-year Treasury yield, for example, has risen sharply since last August, jumping to roughly 1.6% in recent days from last year’s trough of about 0.5%.

Although losses dominate bond returns this year, a few corners have bucked the trend. Notably, junk bonds are posting modest year-to-date gains. The top performer on our ETF fixed-income list: SPDR® Bloomberg Barclays Short Term High Yield Bond ETF (NYSE:SJNK), which is up 1.6% in 2021. iShares 0-5 Year TIPS Bond ETF (NYSE:STIP) are a close second-place winner this year (+1.3%), followed by SPDR® Bloomberg Barclays (LON:BARC) Investment Grade Floating Rate ETF (NYSE:FLRN), which is up fractionally (+0.3%). Invesco Senior Loan ETF (NYSE:BKLN) is the fourth-best winner this year, just barely, rising 0.1%.

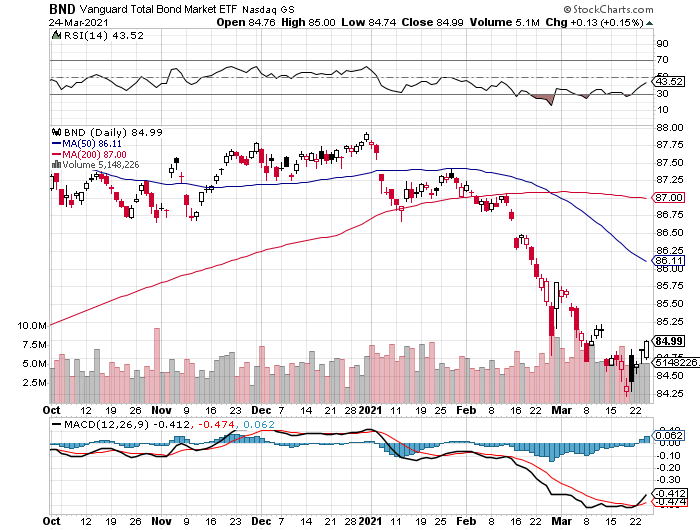
The gains are the exception. The US investment-grade benchmark, based on Vanguard Total Bond Market Index Fund ETF Shares (NASDAQ:BND), is down 3.3% year to date.
The selling has abated in recent days, raising the possibility that the worst of the fixed-income rout has passed if not ended entirely. Indeed, BND rose for a fourth straight day yesterday, its longest stretch of daily gains since November.

Perhaps a period of relative stability for the bond market is coming. Or is this the calm before the next leg down? Unclear, although one analyst recommends maintaining a cautious outlook for fixed income.
“Bond yields rise until they break something, until they cause pain for borrowers,” says Carl Astorri, head of asset allocation at AustralianSuper Pty., which manages A$210 billion ($161 billion). “At the moment, we’re assuming that we’re entering, at the very least, a standard expansion phase of the cycle and quite possibly a kind of overheat or a boom.”
