Everyone hated energy ETFs last year as plunging oil and natural gas prices eroded valuations of companies engaged in this sector. The weakening demand for global commodities wrought havoc among large oil producers, exploration companies, and even storage conglomerates.
Fast forward to 2016, and the narrative has turned from one of relative weakness to an important mainstay of broad market momentum. The Energy Select Sector SPDR (XLE (NYSE:XLE)) has ripped more than 20% from its lows and is now the second strongest sector on a year-to-date basis behind utility stocks.
XLE tracks 40 large cap oil and gas stocks that include recognizable mega companies Exxon Mobil Corp (NYSE:XOM) and Chevron Corp (NYSE:CVX). This ETF has $14 billion in total assets and charges an expense ratio of 0.14%.
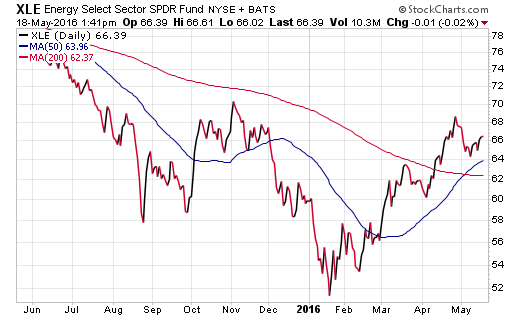
As you can see on the chart below, XLE has been consistently trending above its 50-day moving average (smooth blue line) since mid-February. The solid strength behind this move has been driven by a resurgence in crude oil prices alongside a concomitant weakening of the U.S. dollar. Both factors are supportive of the fundamental story behind oil stocks.

Furthermore, XLE has proven to be an important counter-trend component of the more recent consolidation here in May. While many beloved areas of the market have stalled due to valuation concerns, energy stocks have continued to work under the radar. This is a significant change in character compared to the outsized volatility and “sell at any cost” mentality that this sector traded through last year.
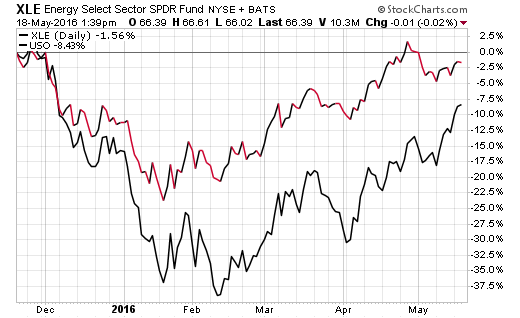
Of course, moving forward, the story for energy ETFs is going to be driven heavily by their correlation with oil prices. The chart below shows just how correlated XLE has been with the United States Oil Fund (NYSE:USO) over the last six months. A consolidation or weakening of the commodities trend may ultimately reign in the hard won momentum that these stocks have created.

The halo effect of energy stocks can be felt throughout many other areas of your portfolio as well. For example, dividend-focused indexes are often loaded with energy companies. The iShares Core High Dividend (NYSE:HDV) has 21% of its portfolio in the energy sector. Similarly, the master limited partnerships that make up the ALPS Alerian MLP (NYSE:AMLP) will be heavily influenced by the fluctuations in commodity prices.
This also extends to value-centric indexes such as the iShares Russell 1000 Value (NYSE:IWD). This ETF counts the energy sector as its second largest component with 13.51% of the total portfolio and XOM as its largest holding.
The Bottom Line
You can count on those who have direct exposure to energy stocks or energy ETFs to keep a close eye on this story. However, in my opinion, this sector represents a very key component of the overall market narrative in 2016 and will be a fundamental driver of where we end the year. That means it represents a more comprehensive catalyst for broad indexes and other related industry components.
Disclosure : FMD Capital Management, its executives, and/or its clients may hold positions in the ETFs, mutual funds or any investment asset mentioned in this article. The commentary does not constitute individualized investment advice. The opinions offered herein are not personalized recommendations to buy, sell or hold securities.
