When a stock market is in runaway uptrend mode and refuses to pull back substantially, most investors and traders think, “I am not buying stocks at this level; I’ll just wait for a pullback.” Eventually that pullback will come, but often only after a multi-month advance has passed. This is why, in strongly uptrending markets, we find it much easier and more profitable to focus on the price action and technical patterns of individual leadership stocks and ETFs, rather than paying much attention to whether or not the charts of the S&P, Nasdaq, and Dow are “overbought” (we hate that useless term).
As long as there remains institutional rotation among leading stocks, with new breakouts continually emerging, the broad market will continue to push higher (although the major averages must also avoid significant distribution). That’s why “overbought” markets often become even more “overbought” than traders would expect before eventually entering into a substantial correction.
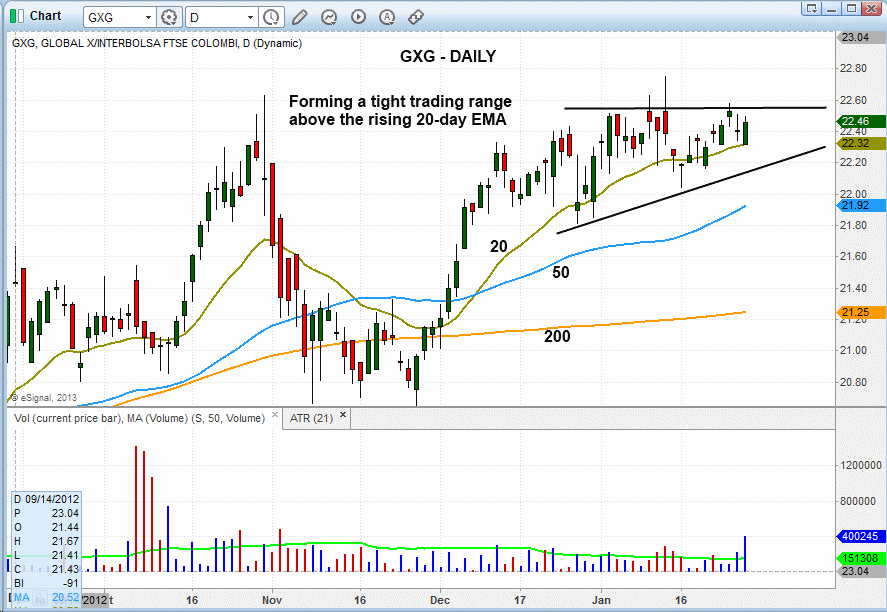
The majority of ETF positions presently in the Model ETF Portfolio of our end-of-day trading newsletter are international ETFs because they continue to show the most relative strength (compared to other ETFs in the domestic market). One of our open positions, Global X FTSE Colombia 20 (GXG), has not yet moved much from our original buy entry point, but we like the current price action:
Since undergoing a false breakout on January 15, GXG has pulled back to and held support of the 20-day exponential moving average (beige line on the chart above). In the process, it also formed a higher “swing low,” which is bullish. Notice that the price has also tightened up nicely since mid-December of 2012. All of this means GXG could finally be ready to break out above the $22.60 area. If it does, we plan to add to our existing position.
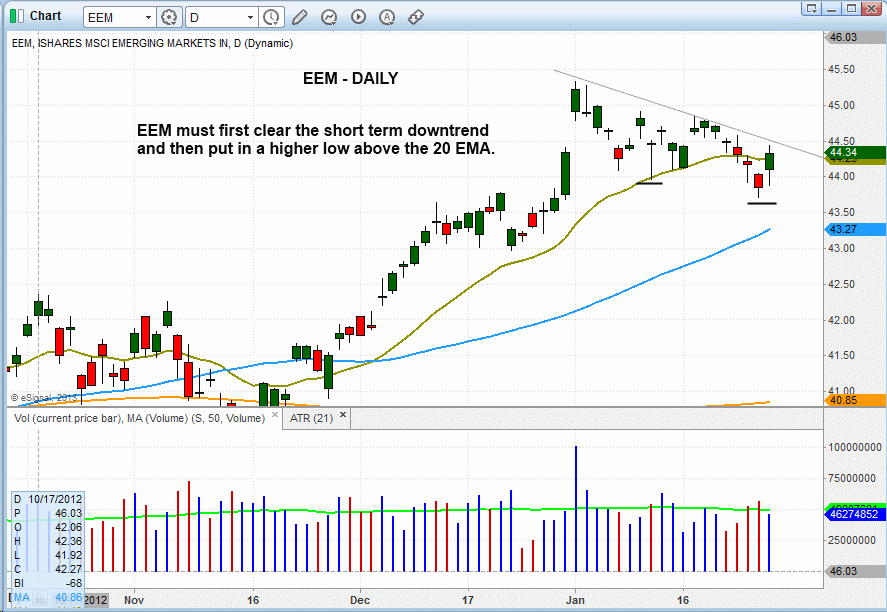
While on the theme of international ETFs, let’s take an updated look at the technical chart pattern of the diversified iShares MSCI Emerging Markets Index (EEM), which we initially mentioned last week as a potential buy setup if it made a higher “swing low” and held support of its 20-day exponential moving average:
Although the price of EEM did not hold above the 20-day EMA, a quick dip (“undercut”) below that moving average, followed by a quick recovery back above it, would keep this bullish setup intact. Therefore, if $EEM can rally above the short-term downtrend line annotated on the chart above, and subsequently put in a “higher low,” we might be able to grab a low-risk buy entry point as early as next week. As always, we will keep subscribers updated if any action is taken on EEM, or any other ETF with a buyable chart pattern that crosses our radar screen while doing our extensive nightly stock scanning.
Original post
- English (UK)
- English (India)
- English (Canada)
- English (Australia)
- English (South Africa)
- English (Philippines)
- English (Nigeria)
- Deutsch
- Español (España)
- Español (México)
- Français
- Italiano
- Nederlands
- Português (Portugal)
- Polski
- Português (Brasil)
- Русский
- Türkçe
- العربية
- Ελληνικά
- Svenska
- Suomi
- עברית
- 日本語
- 한국어
- 简体中文
- 繁體中文
- Bahasa Indonesia
- Bahasa Melayu
- ไทย
- Tiếng Việt
- हिंदी
Why We Don’t Care If The Stock Market Is Overbought
Published 01/30/2013, 06:01 AM
Updated 07/09/2023, 06:31 AM
Why We Don’t Care If The Stock Market Is Overbought
Latest comments
Loading next article…
Install Our App
Risk Disclosure: Trading in financial instruments and/or cryptocurrencies involves high risks including the risk of losing some, or all, of your investment amount, and may not be suitable for all investors. Prices of cryptocurrencies are extremely volatile and may be affected by external factors such as financial, regulatory or political events. Trading on margin increases the financial risks.
Before deciding to trade in financial instrument or cryptocurrencies you should be fully informed of the risks and costs associated with trading the financial markets, carefully consider your investment objectives, level of experience, and risk appetite, and seek professional advice where needed.
Fusion Media would like to remind you that the data contained in this website is not necessarily real-time nor accurate. The data and prices on the website are not necessarily provided by any market or exchange, but may be provided by market makers, and so prices may not be accurate and may differ from the actual price at any given market, meaning prices are indicative and not appropriate for trading purposes. Fusion Media and any provider of the data contained in this website will not accept liability for any loss or damage as a result of your trading, or your reliance on the information contained within this website.
It is prohibited to use, store, reproduce, display, modify, transmit or distribute the data contained in this website without the explicit prior written permission of Fusion Media and/or the data provider. All intellectual property rights are reserved by the providers and/or the exchange providing the data contained in this website.
Fusion Media may be compensated by the advertisers that appear on the website, based on your interaction with the advertisements or advertisers.
© 2007-2025 - Fusion Media Limited. All Rights Reserved.
