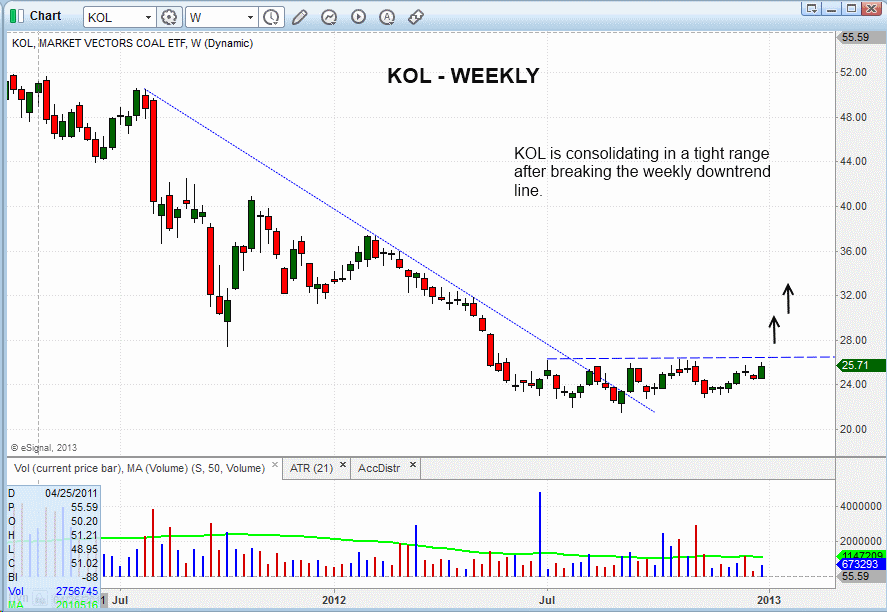
Our nightly ETF screening on Thursday did not turn up many actionable swing trade setups at the moment, which is to be expected after such a big gap up in the market. Nevertheless, we were able to find one ETF that has been consolidating in a tight range over the past few months, after breaking above a weekly downtrend line.
Market Vectors Coal ETF (KOL) is currently forming a “base at the lows,” after undergoing a significant decline from the highs of 2011. These lower level bases can be tricky to enter, as we usually see one or more false breakouts along the way before the real breakout occurs. The recent basing at the lows is shown on the weekly chart pattern of KOL below:
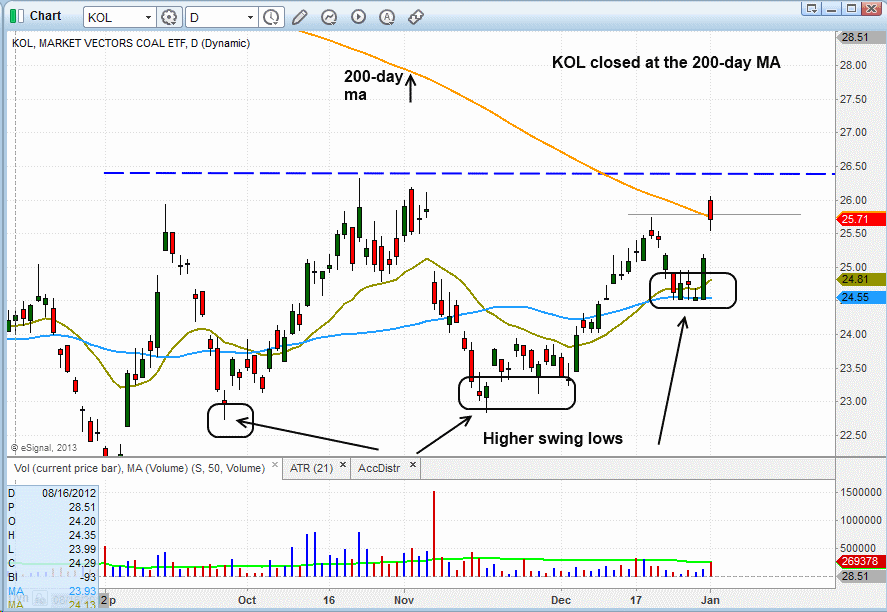
The shorter-term daily chart of $KOL below shows the 50-day MA (teal line) starting to trend higher over the past few months and the 20-day EMA has now crossed above the 50-day MA and is pointing higher. The 50-day MA is still trading below the 200-day MA, but that is to be expected on a lower level base breakout. Still, we should always see the price action above the 50-day MA before doing any buying of a base at the lows:
With this type of technical ETF trading setup, the idea is not to catch a bottom; rather, we wait for some bullish momentum to build before establishing a position. We also see higher “swing lows” forming within the base, which is a bullish sign. If the price action pauses for a day or two in the $25.30 to $26.00 area, we might be able to grab a low-risk entry point on a breakout above a two or three-day high, which would also put the price back above the 200-day MA. If this ETF meets our strict technical criteria for swing trade buy entry, regular newsletter subscribers will be notified in advance with exact trade details for the setup.
With the main stock market indexes posting back to back accumulation days (higher volume gains), the odds of the broad market staging a significant rally have increased dramatically in just a few days. Yet, the true test will come over the next two to three weeks, as we look for new ETF and stock breakouts to hold and extend higher, as new technical setups are developing.
Such a constant rotation of fresh potential ETF and stock breakouts is one of the key factors we look for to confirm that a new bull market may be under way. Obviously, that hasn’t happened yet, but this at least gives you an idea of what to be looking for as a reliable indicator of whether or not recent strength in the stock market will be sustainable.
Original post
- English (UK)
- English (India)
- English (Canada)
- English (Australia)
- English (South Africa)
- English (Philippines)
- English (Nigeria)
- Deutsch
- Español (España)
- Español (México)
- Français
- Italiano
- Nederlands
- Polski
- Português (Portugal)
- Português (Brasil)
- Русский
- Türkçe
- العربية
- Ελληνικά
- Svenska
- Suomi
- עברית
- 日本語
- 한국어
- 简体中文
- 繁體中文
- Bahasa Indonesia
- Bahasa Melayu
- ไทย
- Tiếng Việt
- हिंदी
Why We Are Stalking Market Vectors Coal ETF For Potential Buy (KOL)
Published 01/04/2013, 02:11 AM
Why We Are Stalking Market Vectors Coal ETF For Potential Buy (KOL)
Latest comments
Loading next article…
Install Our App
Risk Disclosure: Trading in financial instruments and/or cryptocurrencies involves high risks including the risk of losing some, or all, of your investment amount, and may not be suitable for all investors. Prices of cryptocurrencies are extremely volatile and may be affected by external factors such as financial, regulatory or political events. Trading on margin increases the financial risks.
Before deciding to trade in financial instrument or cryptocurrencies you should be fully informed of the risks and costs associated with trading the financial markets, carefully consider your investment objectives, level of experience, and risk appetite, and seek professional advice where needed.
Fusion Media would like to remind you that the data contained in this website is not necessarily real-time nor accurate. The data and prices on the website are not necessarily provided by any market or exchange, but may be provided by market makers, and so prices may not be accurate and may differ from the actual price at any given market, meaning prices are indicative and not appropriate for trading purposes. Fusion Media and any provider of the data contained in this website will not accept liability for any loss or damage as a result of your trading, or your reliance on the information contained within this website.
It is prohibited to use, store, reproduce, display, modify, transmit or distribute the data contained in this website without the explicit prior written permission of Fusion Media and/or the data provider. All intellectual property rights are reserved by the providers and/or the exchange providing the data contained in this website.
Fusion Media may be compensated by the advertisers that appear on the website, based on your interaction with the advertisements or advertisers.
© 2007-2025 - Fusion Media Limited. All Rights Reserved.
