Back in February 2015, Bob Dudley, BP PLC's (NYSE:BP) CEO, said in a Bloomberg TV interview that the fundamental supply and demand picture reminded him of 1986, and he feared we could go into a period of lower oil prices perhaps staying in a range below $60/bbl for as long as three years. He added "It will be a long time before we see $100/bbl again."
Here in late August, with WTI having dipped below $39/bbl and with Brent prices under $44/bbl, Bob is looking kind of prescient and many more analysts and talking heads have jumped onto the "lower-for-longer" bandwagon. But I think the analogy he drew between 1986 and 2015 is flawed.
Here's why.
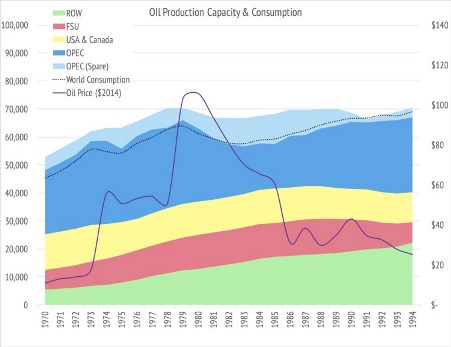
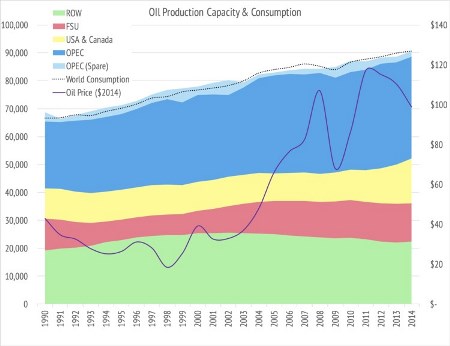
In 1986 we had just been through two oil price shocks that saw the OPEC cartel first discover its power and then overplay its hand quite spectacularly. Let me start with a little explanation of the data on the charts below. Everything I say about the oil price is drawn from analysis of data so it is worth understanding that data before diving into the conclusions. The green zone is the rest of the world (the likes of the North Sea, Mexico, China and so on); then the red area, somewhat appropriately, represents the Former Soviet Union; the U.S.A and Canada is in yellow; and finally the blue is OPEC, with OPEC's spare capacity in pale blue sitting above the sum of total world production. World oil consumption (less biofuels) is the dotted line and the annual average oil price in 2014 $/bbl is the solid line.
Consumption doesn't equal production because, well, just because. BP, whose data I am using, says:
"Differences between these world consumption figures and world production statistics are accounted for by stock changes, consumption of non-petroleum additives and substitute fuels, and unavoidable disparities in the definition, measurement or conversion of oil supply and demand data."
So as I said, just because. Before the eighties the consumption figures track just below production, after that they typically track just above production.

Oil price, production & consumption data BP; OPEC spare capacity EIA
Before the first oil shock in the early seventies the oil price depended mostly on the Texas Railroad Commission and the whims of the Seven Sisters, but then in 1973 the Arab oil embargo caused a jump in prices and OPEC was in charge. The 1973 increase in oil prices dented world economic growth, though not to the extent that OPEC lost all that much market share. It took the second leap in prices in 1979 to do that. After the oil price climbed above $100/bbl (in today's money) world oil consumption fell pretty rapidly, and on top of that OPEC's market share fell from 49 percent in 1976 to 28 percent in 1985. A lot of that pain was borne by Saudi Arabia whose market share fell from 15 percent to just over 6 percent. With that historical context, you can understand why defending market share matters to OPEC and the Saudis.
By 1986 with a huge overhang of excess capacity, and OPEC desperate to rebuild its market share, the oil price collapsed, only rebounding a little when OPEC spare capacity was decimated by the Gulf War. In time, low oil prices stimulated growth in oil consumption, but it took nearly two decades before "low prices cured low prices" and there was another seismic shift in the markets.
It wasn't until the early years of this new century that growth in consumption began to outstrip growth in production capacity (helped along by the loss in capacity caused by another Iraq War). That shift in the market dynamics started a march up in oil prices which culminated in a cargo, or maybe a paper barrel, changing hands at $147/bbl. You can see in this second chart that prices tend to be higher when oil consumption exceeds this proxy for world production capacity (when the dotted line is above OPEC spare capacity) and that oil prices start to head lower when capacity exceeds consumption. It seems that oil is in fact not a special commodity and that it just obeys the laws of supply and demand like any other product.

Oil price, production & consumption data BP; OPEC spare capacity EIA
Of course the oil price does have the magical power of altering world economic growth but that is just how the price mechanism works when there aren't readily available substitutes, as in the transport fuels market.
So why is 2015 not like 1985? Well, in 1985 OPEC's market share was less than 30 percent, down nearly 20 percentage points from a decade previous, during which time oil prices had averaged over $70/bbl in 2015 money. Saudi Arabia produced just 3.6 mmbbls/day in 1985, a dramatic decline from the 10 mmbbls/day it had produced just four years previously. For the Saudis this was a devastating loss of revenue and more importantly loss of prestige and control of the market. Not an experience to repeat.
Conversely, at the end of 2014, OPEC's market share was still over 40 percent, less than 2 percent down from a decade before, during which time oil prices had averaged over $90/bbl. The world has changed from the eighties to now; back then even moderately high oil prices reduced world oil demand and destroyed OPEC's market share, nowadays both oil demand and OPEC's market share has been pretty robust to $90/bbl oil.
However, the lessons of the eighties were painful for OPEC, so when market share started to decline just a little, pre-emptive action to snuff out further growth in U.S. Light Tight Oil was perhaps inevitable.
So what is next, and when will prices recover?
OPEC has been expecting both supply and demand to react to the lower oil price but the world economy is looking a tad shaky so the demand response may take longer than they might have hoped. If recession delays a demand drive price recovery, it seems to me that one of two things might happen to raise the oil price: some unforeseen event that chokes off a good few hundred thousand barrels per day of production could take place; or, OPEC might, in its own self-interest, ease off on its strategic over-supply of the oil market.
There is even now talk of an emergency meeting, but OPEC probably won’t act until they are sure U.S. production is firmly in decline, and they can't really be sure of that until U.S. production falls below 9 mmbbls/day. The EIA thinks that won't happen until 2016, having poked into the detail of production in the Eagle Ford, Bakken and Permian, I suspect it will roll along a little sooner than that, but that might just be wishful thinking on my part.
