In the later stages of a bull market advance, the financial media and Wall Street analysts start seeking out rationalizations to support their bullish views. One common refrain is “there are trillions of dollars in cash sitting on the sidelines just waiting to come into the market.”
For example, Barron’s recently penned the following:
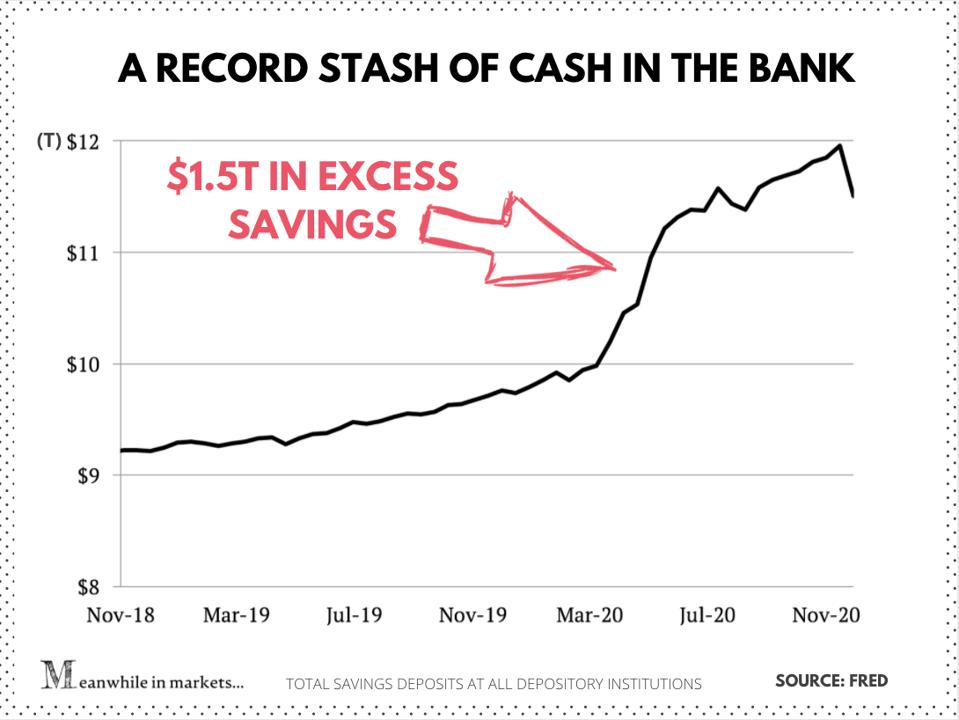
“There is record amounts of cash sitting in checking accounts of American households—and for optimistic investors, it’s just one more reason the stock market should keep pushing higher.
Yahoo Finance also jumped on the claim:
“It should also come as no surprise that there’s never been so much cash sitting on the sidelines—nearly $5 trillion, as a matter of fact. This is significantly above the record $3.8 trillion in cash set back in January 2009 during the financial crisis!”
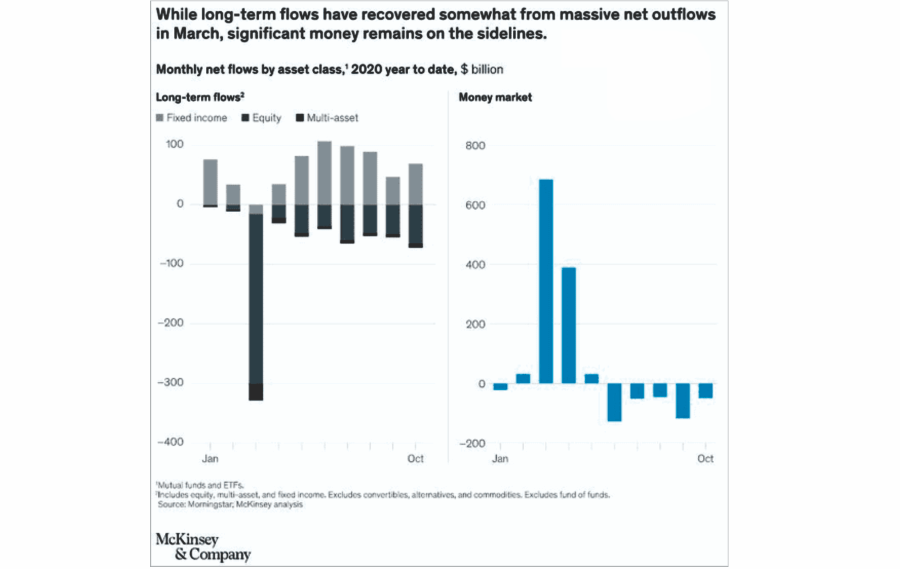
McKinsey & Co also published the following graphic.
See. There are just tons of “cash on the sidelines” waiting to flow into the market.
Except there isn’t.
The Myth Of Cash On The Sidelines
Despite 10-years of a bull market advance, one of the prevailing myths that seemingly will not die is that of “cash on the sidelines.” To wit:
“A growth bomb”: 3.5$ trillion of excess cash on the sidelines” – Forbes
Please stop it.
Such is the age-old excuse why the current “bull market” rally is set to continue into the indefinite future. The ongoing belief is that at any moment, investors are suddenly going to empty bank accounts and pour them into the markets. However, the reality is if they haven’t done it by now, following 4-consecutive rounds of Q.E. in the U.S., a 400% advance in the markets, and ongoing global Q.E., precisely what is it going to take?
But here is the other problem.
For Every Buyer
For every buyer, there MUST be someone willing to sell. As noted by Clifford Asness:
“There are no sidelines. Those saying this seem to envision a seller of stocks moving money to cash and awaiting a chance to return. But they always ignore that this seller sold to somebody, who presumably moved a precisely equal amount of cash off the sidelines.”
Every transaction in the market requires both a buyer and a seller, with the only differentiating factor being at what PRICE the transaction occurs. Since this is necessary for there to be equilibrium in the markets, there can be no “sidelines.”
Think of this dynamic like a football game. Each team must field 11 players despite having over 50 players on the team. If a player comes off the sidelines to replace a player on the field, the substituted player will join the other sidelined players’ ranks. Notably, at all times, there will only be 11 players per team on the field. Such holds equally true if teams expand to 100 or even 1000 players.
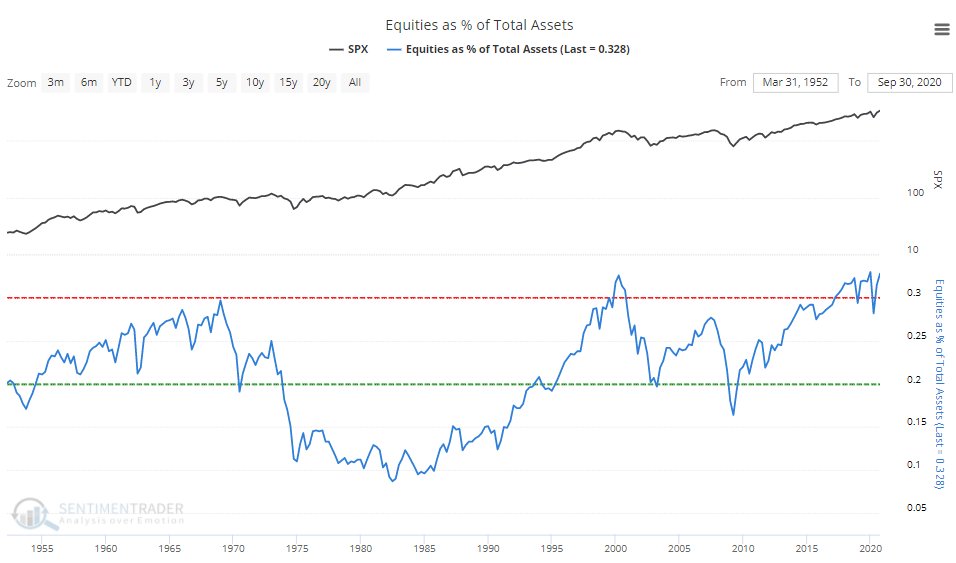
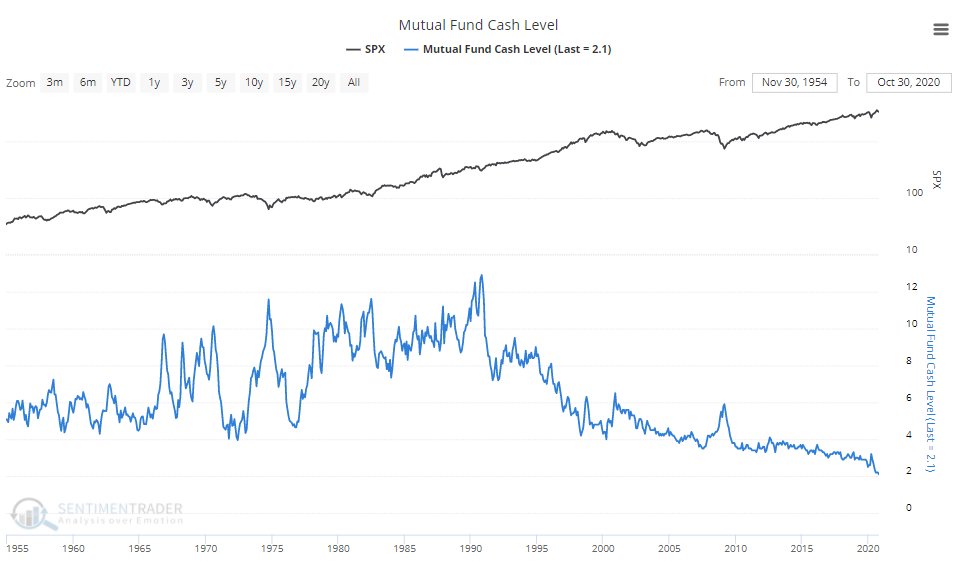
Furthermore, despite this very salient point, a look at the stock-to-cash ratios (cash as a percentage of investment portfolios) also suggests there is very little available buying power for investors currently. As we noted just recently with charts from Sentiment Trader:
The Lack Of Cash
As asset prices have escalated, so has an individual’s appetite to chase risk. The herding into equities suggests that investors have thrown caution to the wind. Such also means they have deployed most of their investible cash.
Of course, once you run out of cash to invest, the next step is to “borrow cash” to increase equity allocations. With professional investors leveraging their bets, there isn’t much excess cash sitting around.
Mutual fund managers are also holding record low levels of cash.
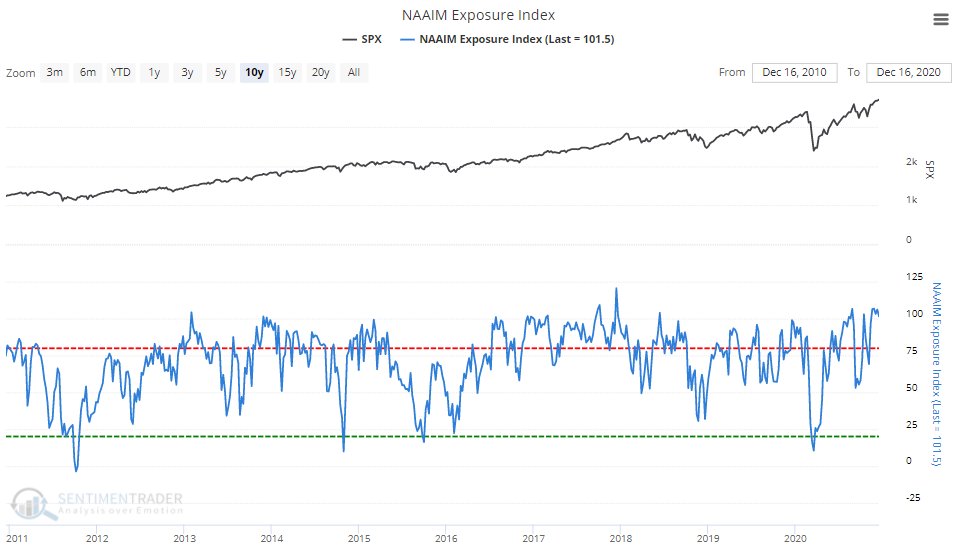
With net exposure to equity risk by individuals at historically high levels, it suggests two things:
- There is little buying left from individuals to push markets marginally higher, and;
- The stock/cash ratio, shown below, is at levels ordinarily coincident with more important market peaks.
The reality is investors are holding very little ‘cash’ as they have gone “all-in” to chase the market higher.
So, Where Is All This Cash Then?
The statement is correct in that money market cash levels have indeed been climbing. The chart from the Office Of Financial Research shows this: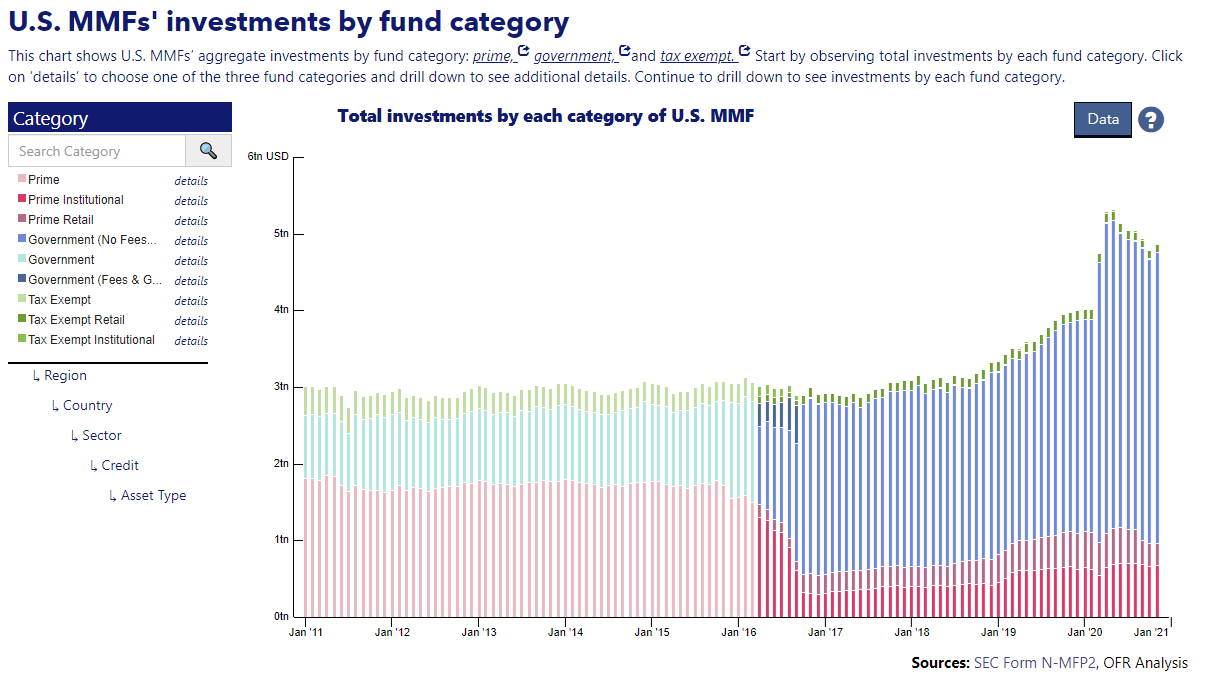
There are a few things we need to consider concerning money market funds.
- Just because I have money in a money market account doesn’t mean I am saving it for investing purposes. It could be an emergency savings account, a down payment for a house, or a vacation fund on which I want to earn a higher rate of interest.
- Also, corporations use money markets to store cash for payroll, capital expenditures, operations, and various other uses not related to investing in the stock market.
- Foreign entities also store cash in the U.S. for transactions processed in the United States, which they may not want to repatriate back into their country of origin immediately.
The list goes on, but you get the idea.
If you look at the chart above, you will notice that the bulk of the money is in Government Money Market funds. These particular types of money market funds generally have much higher account minimums (from $100,000 to $1 million), suggesting these funds are not retail investors. (Those would be the smaller balances of prime retail funds.)
Corporations Are Hoarding Cash
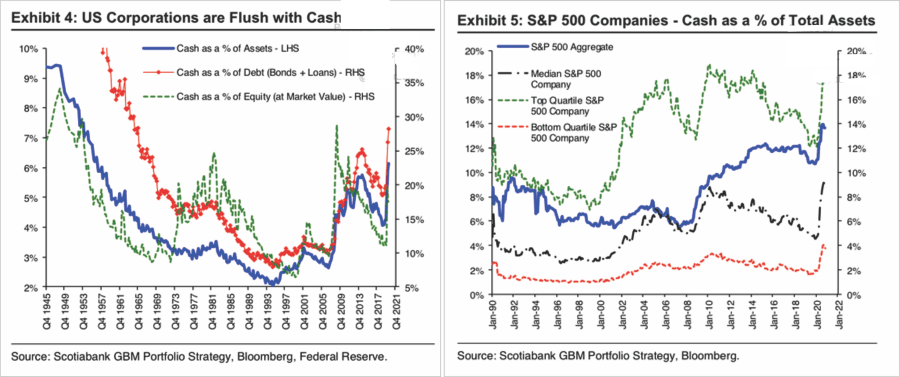
As noted, much of the “cash on the sidelines” is held by corporations. As we said in “A Major Support For Assets Has Reversed,” such isn’t a surprise:
CEO’s make decisions on how they use their cash. If concerns of a recession persist, companies will become more conservative on the use of their cash, rather than continuing to repurchase shares.” – September 2019
As we also stated in that article:
“When stock prices do eventually fall, companies that performed un-economic buybacks would find themselves with financial losses on their hands, more debt on their balance sheets, and fewer opportunities to grow in the future. Equally disturbing, the many CEO’s who sanctioned buybacks, are much wealthier and unaccountable for their actions.”
As we saw, the same companies which have spent billions on “share buybacks” over the last decade were the first ones in line for a Government bailout earlier this year. Now, companies are hoarding cash as we approach the end of the year to ensure their survival against a weaker economic environment in 2021.
Debt-Driven Cash Levels
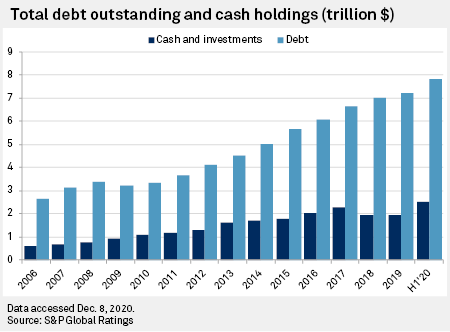
The other problem is that record debt issuance by corporations was the driver of record-cash levels. As per the WSJ:
“Cash hoards swelled this year after companies issued record-breaking amounts of debt to bolster their balance sheets against the Covid-19 pandemic’s disruptions. As of Nov. 30, U.S. companies had sold more than $2 trillion of investment-grade and high-yield bonds—the most on record in data going back to 2006—according to LCD, a unit of S&P Global Market Intelligence.
At the same time, many cut share repurchases, dividends or capital expenditures.”
Of course, the problem with debt is that it is not “free” money even at low-interest rates. The interest on the debt diverts capital from productive investments. Companies must use their cash to make “productive” investments that will generate a return higher than the debt cost or pay down debt. Given that economic growth will likely remain weak, along with revenue growth, the former will be difficult. If inflationary pressures and interest rates rise, as many expect, cash will get used to pay off debt rather than invest.
While the bulls are certainly hoping the “cash hoard” will flow into U.S. equities, the reality may be quite different.
What Changes The Game
As noted above, the stock market is always a function of buyers and sellers, each negotiating to make a transaction. While there is a buyer for every seller, but the question is always at “what price?”
In the current bull market advance, few people are willing to sell, so buyers must keep bidding up prices to attract a seller to make a transaction. As long as this remains the case, and exuberance exceeds logic, buyers will continue to pay higher prices to get into the positions they want to own.
Such is the very definition of the “greater fool” theory.
However, at some point, for whatever reason, this dynamic will change. Buyers will become more scarce as they refuse to pay a higher price. When sellers realize the change, there will be a rush to sell to a diminishing pool of buyers. Eventually, sellers begin to “panic sell” as buyers evaporate and prices plunge.
Sellers live higher. Buyers live lower.
What causes that change? No one knows.
But that is how bear markets begin.
Slowly at first. Then all of a sudden.

