In 2013, I began warning about the risk to oil prices due to the ongoing imbalances between global supply and demand. Those warnings fell on deaf ears as it was believed that “oil prices could only go higher from here.”
It didn’t take long for those predictions to play out. In May of 2014, I wrote:
While it is likely oil prices could get a bit of a bump from a decline in the U.S. dollar, ultimately it will come down to the fundamentals longer term. It is quite clear that the speculative rise in oil prices due to the ‘fracking miracle’ has come to its inglorious, but expected conclusion…It is quite apparent that some lessons are simply never learned.
Of course, as with all things, particularly when it comes to commodities, it doesn’t take long for speculation to once again grab hold and drive prices higher in the short-term despite the long-term fundamental problems which still exist.
In September of 2017, I wrote a piece reviewing those fundamentals.
I have been getting a tremendous number of emails as of late asking if the latest rally in oil prices, and related energy stocks, is sustainable or is it another ‘trap’ as has been witnessed previously.
As regular readers know, we exited oil and gas stocks back in mid-2014 and have remained out of the sector for technical and fundamental reasons for the duration. While there have been some opportunistic trading setups, the technical backdrop has remained decidedly bearish.
The conclusion was not what most were hoping for.
While there is hope the production cuts will continue into 2018, a bulk of the current price gain has likely already been priced in. With oil prices once again overbought on a monthly basis, the risk of disappointment is substantial.
Well, here we are wrapping up 2018 and the prices of both energy-related shares and oil have been disappointing.
The expected decline in oil prices is more important than just the relative decline in share prices of energy-related stocks. As I wrote previously, energy prices are highly correlated to economic activity. To wit:
Oil is a highly sensitive indicator relative to the expansion or contraction of the economy. Given that oil is consumed in virtually every aspect of our lives, from the food we eat to the products and services we buy, the demand side of the equation is a tell-tale sign of economic strength or weakness.
The chart below combines interest rates, inflation, and GDP into one composite indicator to provide a clearer comparison to oil prices. One important note is that oil tends to trade along a pretty defined trend…until it doesn’t. Given that the oil industry is very manufacturing and production intensive, breaks of price trends tend to be liquidation events which have a negative impact on the manufacturing and CapEx spending inputs into the GDP calculation.
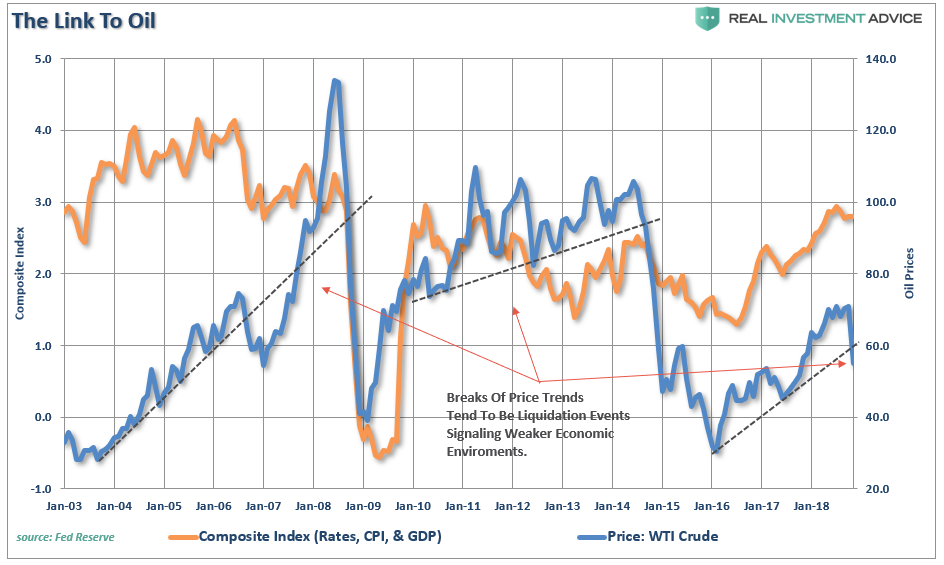
As such, it is not surprising that sharp declines in oil prices have been coincident with downturns in economic activity, a drop in inflation, and a subsequent decline in interest rates.
Since then, the price of oil has declined further as economic weakness continues to gain traction globally. Despite the occasional rally, it’s hard to see the outlook for oil is encouraging on both fundamental and technical levels. The charts for WTI remain bearish, while the fundamentals remain basically “Economics 101: too much supply, too little demand.” The parallel with 2014 is there if you want to see it.
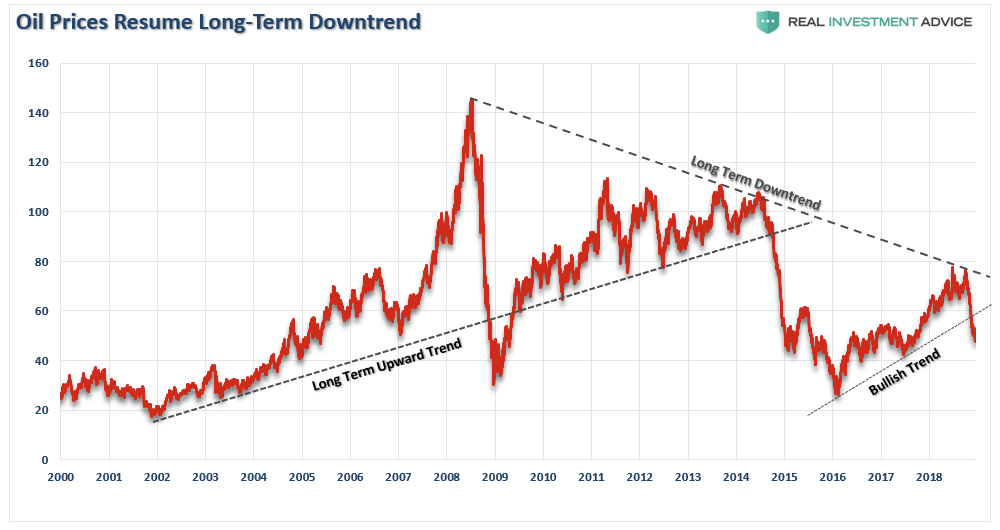
The current levels of supply potentially create a longer-term issue for prices globally particularly in the face of weaker global demand due to demographics, energy efficiencies, and debt.
Many point to the 2008 commodity crash as THE example as to why oil prices are destined to rise in the near term. The clear issue remains supply as it relates to the price of any commodity. With drilling in the Permian Basin expanding currently, any “cuts” by OPEC have already been offset by increased domestic production. As I stated previously, any rise in oil prices beyond $55/bbl would likely make the OPEC “cuts” very short-lived which indeed turned out to be the case.
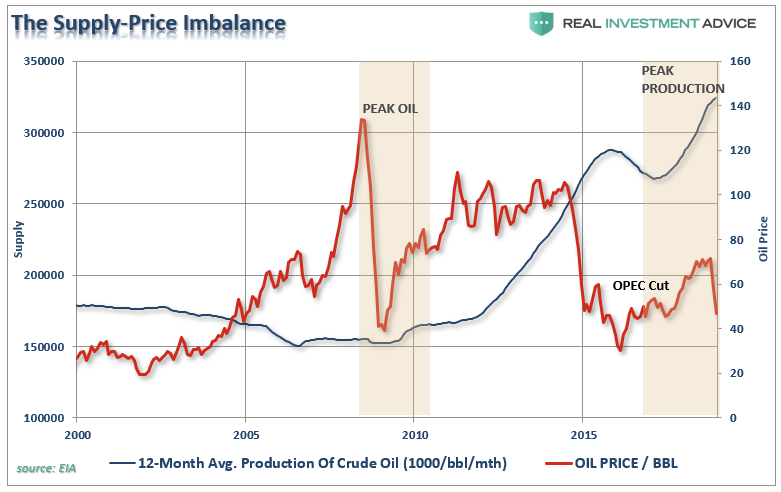
As noted in the chart above, the difference between 2008 and today is that previously the world was fearful of “running out” of oil versus worries about an “oil glut” today. The issues of supply versus price become clearer if we look further back in history to the last crash in commodity prices which marked an extremely long period of oil price suppression as supply was reduced.
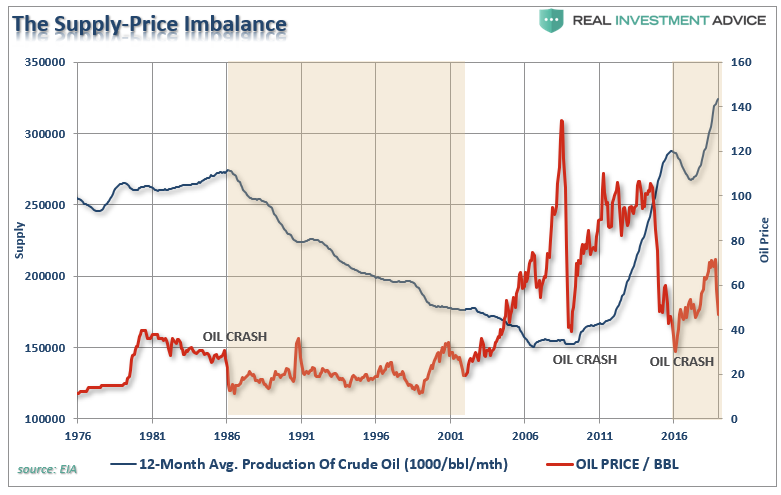
The problem with the recent surge in oil prices was that it was being driven by speculative excess. As I noted in “Everyone Is On The Same Side Of The Boat:”
Of course, the cycle of rising oil prices leading to increased optimism which begets bullish bets on oil continues to press prices higher. However, it is also the exuberance which has repeatedly set up the next fall. As shown below, bets on crude oil prices are sitting near the highest levels on record and substantially higher than what was seen at the peak of oil prices prior to 2008 and 2014.
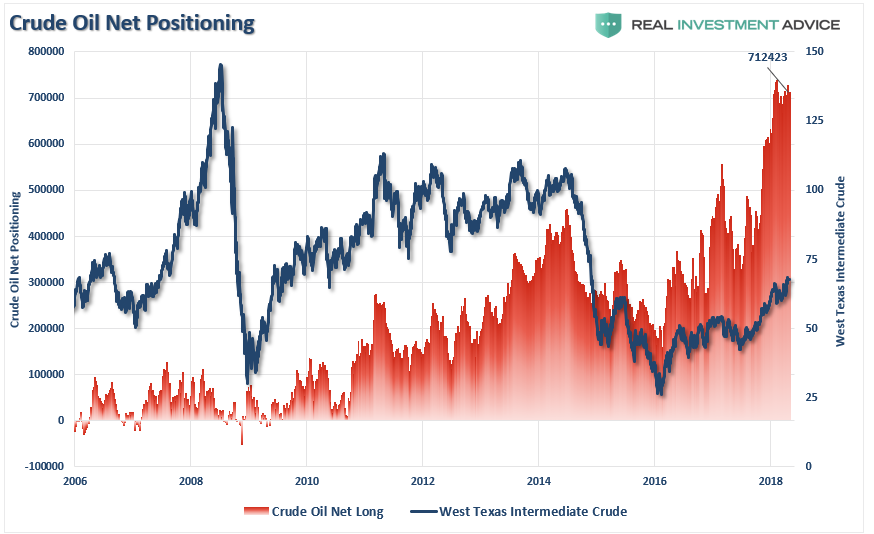
When I wrote that in May of this year (2018), it received a lot of criticism about my misunderstanding of global demand and explanations of why oil prices could only go higher.
It didn’t take long for reality to take hold.
The Headwinds For Oil Remain
In 2008, when prices crashed, the supply of into the marketplace had hit an all-time low while global demand was at an all-time high. Remember, the fears of “peak oil” was rampant in news headlines and in the financial markets. Of course, the financial crisis took hold and quickly realigned prices with demand.
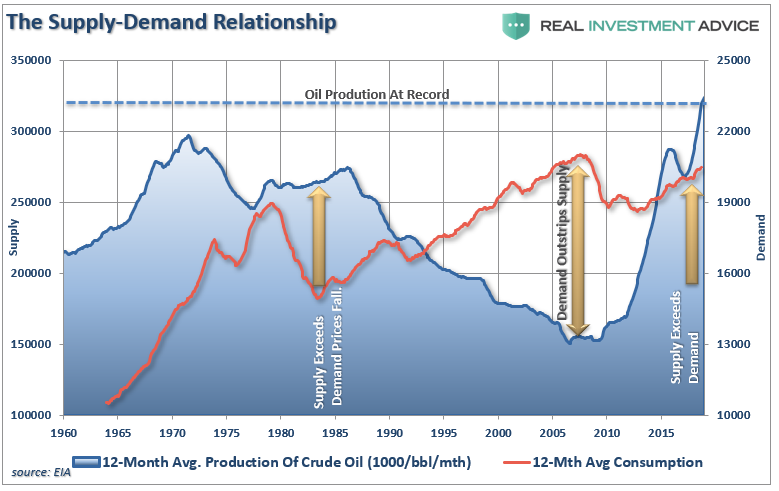
Of course, the supply-demand imbalance, combined with suppressed commodity prices in 2008, was the perfect cocktail for a surge in prices as the “fracking miracle” came into focus. The surge of supply alleviated the fears of oil company stability and investors rushed back into energy-related companies to “feast” on the buffet of accelerating profitability into the infinite future.
The problem currently, and as of yet not fully recognized, is the supply-demand imbalance has once again reverted. With supply now at the highest levels on record, and global demand growth weak due to a rolling debt-cycle driven global deflationary cycle, the dynamics for a repeat of the pre-2008 surge in prices is unlikely.
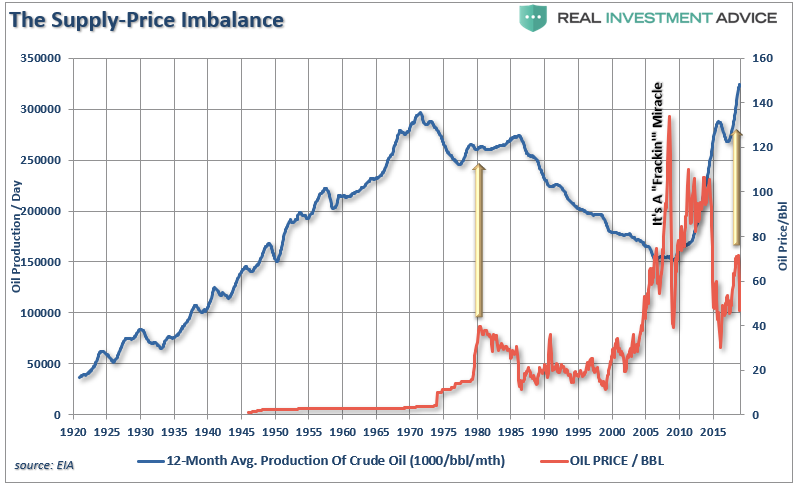
The supply-demand problem is not likely to be resolved over the course of a few months either. The current dynamics of the financial markets, global economies, and the current level of supply is more akin to that of the early-1980’s. Even if OPEC does continue to reduce output, it will continue to be insufficient to offset the increases from shale field production.
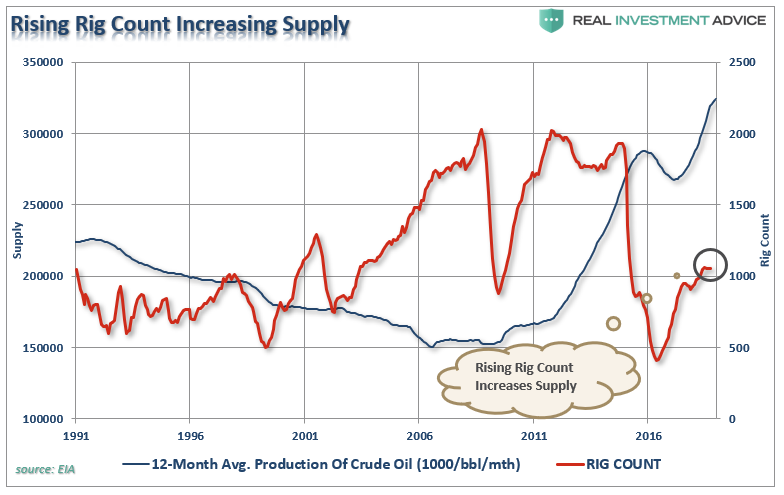
Since oil production, at any price, is the major part of the revenue streams of energy-related companies, it is unlikely they will dramatically gut their production in the short-term. The important backdrop is extraction from shale continues to become cheaper and more efficient all the time. In turn, this lowers the price point where production becomes profitable increases the supply coming to market.
Then there is the demand side of the equation.
For example, my friend Jill Mislinski discussed the issue of a weak economic backdrop.
There are profound behavioral issues apart from gasoline prices that are influencing miles traveled. These would include the demographics of an aging population in which older people drive less, continuing high unemployment, the ever-growing ability to work remote in the era of the Internet and the use of ever-growing communication technologies as a partial substitute for face-to-face interaction.
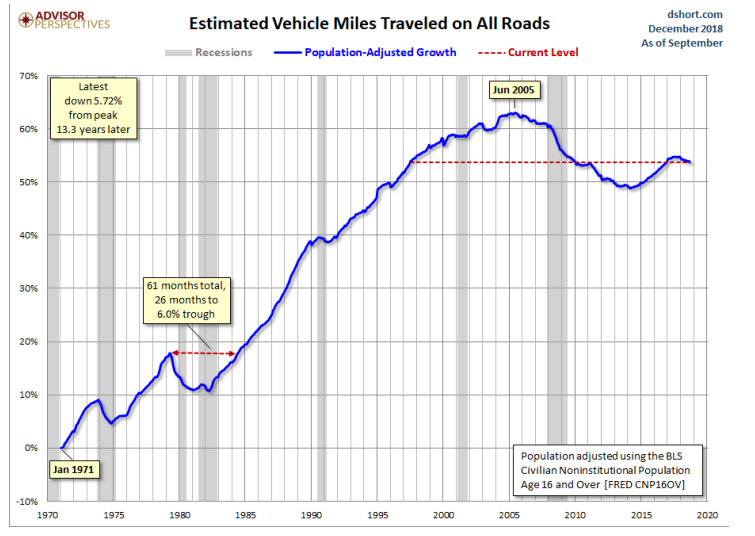
The problem with dropping demand, of course, is the potential for the creation of a “supply glut” that leads to a continued suppression in oil prices.
The headwinds to higher oil prices from the demand side come in a variety of forms:
- Weak economic global growth over the last decade which will remain weak going forward
- Slow and steady growth of renewable/alternative sources of energy
- Technological improvements in energy production, storage and transfer, and;
- A rapidly aging global demographic
Add to those issues that over the next few years EVERY major auto supplier will be continuously rolling out more efficient automobiles including larger offerings of hybrid and fully electric vehicles.
All this boils down to a long-term, secular, and structurally bearish story.
With respect to investors, the argument can be made that oil prices have likely found a long-term bottom in the $40 range. However, the fundamental tailwinds for substantially higher prices are still vacant. OPEC won’t keep cutting production forever, the global economy remains weak, efficiencies are suppressing demand.
Furthermore, given the length of the current economic expansion, the onset of the next recession is likely closer than not. A recession will negatively impact oil prices (which are driven by commodity traders) and energy investments as the proverbial “baby is thrown out with the bathwater.”
This is where we will be looking for long-term bargains in the space.
