This week, I'm going to focus on the Price to Sales ratio for finding great stocks at great values.
The Price to Sales ratio is a great valuation metric. And given the recent run-up in stocks, value, to me, is becoming more and more important.
In fact, aside from the Zacks Rank, if I could only use one item to screen and pick stocks with, this item would be the one.
Definition
Let's first start with a definition.
The Price to Sales ratio is simply: Price divided by Sales
If the Price to Sales ratio is 1, that means you're paying $1 for every $1 of sales the company makes.
A price to sales ratio of 2 means you're paying $2 for every $1 of sales the company makes.
As you might have guessed, the lower the Price the Sales ratio, the better.
A price to Sales ratio of .5 means you're paying 50 cents for every $1 of sales the company makes.
And paying less than a dollar for a dollar's worth of something is a good bargain.
One of the reasons I like the Price to Sales ratio is because it looks at sales rather than earnings, like the P/E ratio does.
And sales are harder to manipulate on an income statement than earnings.
Secondly, I'd be hard pressed to find a screen where adding the Price to Sales ratio didn't improve it.
Price to Sales Study
For me, I prefer to look for stocks with a Price to Sales ratio under 1. Although, I'm willing to go up to 4, depending on the industry.
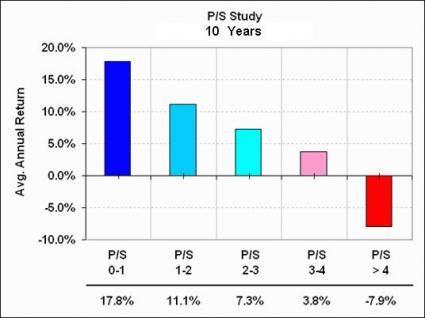
But in my testing, as the illustration below shows, those with a Price to Sales ratio of 1 or less produced the best returns. Between 1 and 2 also outperformed pretty significantly. But once you got over 4, the odds were against you.

- P/S range greater than or equal to 0 and less than or equal to 1:
Average Annual Return: 17.8% - P/S range greater than 1 and less than or equal to 2: Average Annual Return: 11.1%
- P/S range greater than 2 and less than or equal to 3: Average Annual Return: 7.3%
- P/S range greater than 3 and less than or equal to 4: Average Annual Return: 3.8%
- P/S range greater than 4: Average Annual Return: -7.9%
But the best way to use it, I've found, is to find stocks with a Price to Sales ratio below the median for its Industry.
And that's what we'll be focusing on in this week's screen.
Screen Parameters
• Projected Growth Rate greater than or equal to Projected Growth Rate for the S&P
(Above market growth rates.)
• Last Earnings Surprise greater than 0
(Positive EPS Surprise)
• Last Sales Surprise greater than 0
(Positive Sales Surprise)
• Zacks Rank less than or equal to 2
(Only stocks with a Zacks Rank of a Strong Buy or Buy get through.)
• Price to Sales less than or equal to Median Price to Sales for its Industry
(Valuations that are lower than their Industry.)
• Price greater than or equal to $5
• Avg. 20 Day Volume greater than or equal to 100,000
Stock Selections
Here are 5 stocks from this week's list:
BECN Beacon Roofing Supply
CORE Core-Mark Holding
HNI HNI Corp.
IART Integra LifeSciences
POST Post Holdings
Sign up now for your 2 week free trial to the Research Wizard and get the rest of the stocks on this list. Start using this screen and the Price to Sales ratio in your own trading. Or create your own strategies and test them first before you invest. Know what to buy and when to sell.
Learn how today with the Research Wizard.
Want more articles from this author? Scroll up to the top of this article and click the FOLLOW AUTHOR button to get an email each time a new article is published.
Disclosure: Officers, directors and/or employees of Zacks Investment Research may own or have sold short securities and/or hold long and/or short positions in options that are mentioned in this material. An affiliated investment advisory firm may own or have sold short securities and/or hold long and/or short positions in options that are mentioned in this material.
Disclosure: Performance information for Zacks’ portfolios and strategies are available at: https://www.zacks.com/performance.
POST HOLDINGS (POST): Free Stock Analysis Report
INTEGRA LIFESCI (IART): Free Stock Analysis Report
HNI CORP (HNI): Free Stock Analysis Report
CORE-MARK HLDG (CORE): Free Stock Analysis Report
BEACON ROOFING (BECN): Free Stock Analysis Report
Original post
Zacks Investment Research
